Download
1 / 98
980 likes | 1.38k Vues
2. Example

E N D
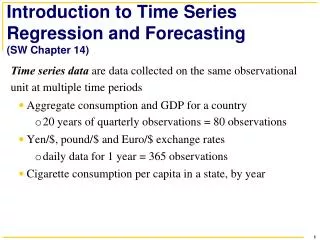
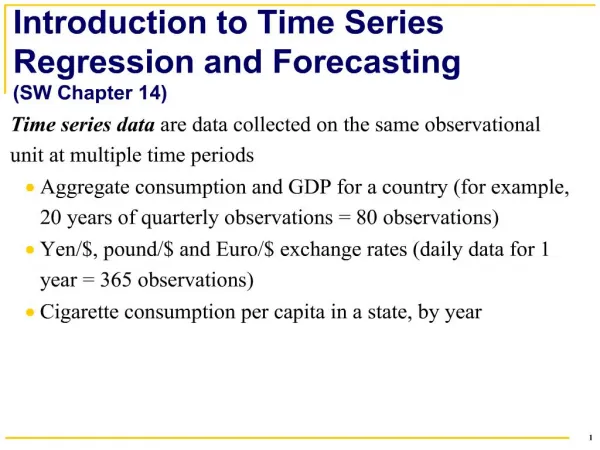
1. 1 Introduction to Time Series Regression and Forecasting(SW Chapter 14)
2. 2
3. 3 Example #2: US rate of unemployment
4. 4 Why use time series data?
5. 5 Time series data raises new technical issues
6. 6 Using Regression Models for Forecasting (SW Section 14.1)
7. 7 Introduction to Time Series Data and Serial Correlation (SW Section 14.2)
8. 8 We will transform time series variables using lags, first differences, logarithms, & growth rates
9. 9 Example: Quarterly rate of inflation at an annual rate (U.S.)
10. 10 Example: US CPI inflation � its first lag and its change
11. 11 Autocorrelation
12. 12
13. 13 Sample autocorrelations
14. 14 Example:
15. 15
16. 16 Other economic time series:
17. 17 Other economic time series, ctd:
18. 18 Stationarity: a key requirement for external validity of time series regression
19. 19 Autoregressions(SW Section 14.3)
20. 20 The First Order Autoregressive (AR(1)) Model
21. 21 Example: AR(1) model of the change in inflation
22. 22 Example: AR(1) model of inflation � STATA
23. 23 Example: AR(1) model of inflation � STATA, ctd.
24. 24 Example: AR(1) model of inflation � STATA, ctd
25. 25 Forecasts: terminology and notation
26. 26 Forecast errors
27. 27 Example: forecasting inflation using an AR(1)
28. 28 The AR(p) model: using multiple lags for forecasting
29. 29 Example: AR(4) model of inflation
30. 30 Example: AR(4) model of inflation � STATA
31. 31 Example: AR(4) model of inflation � STATA, ctd.
32. 32 Digression: we used ?Inf, not Inf, in the AR�s. Why?
33. 33 So why use ?Inft, not Inft?
34. 34 Time Series Regression with Additional Predictors and the Autoregressive Distributed Lag (ADL) Model (SW Section 14.4)
35. 35 Example: inflation and unemployment
36. 36 The empirical U.S. �Phillips Curve,� 1962 � 2004 (annual)
37. 37 The empirical (backwards-looking) Phillips Curve, ctd.
38. 38 Example: dinf and unem � STATA
39. 39 Example: ADL(4,4) model of inflation � STATA, ctd.
40. 40 The test of the joint hypothesis that none of the X�s is a useful predictor, above and beyond lagged values of Y, is called a Granger causality test
41. 41 Forecast uncertainty and forecast intervals
42. 42 The mean squared forecast error (MSFE) is,
43. 43 The root mean squared forecast error (RMSFE)
44. 44 Three ways to estimate the RMSFE
45. 45 The method of pseudo out-of-sample forecasting
46. 46 Using the RMSFE to construct forecast intervals
47. 47 Example #1: the Bank of England �Fan Chart�, 11/05
48. 48 Example #2: Monthly Bulletin of the European Central Bank, Dec. 2005, Staff macroeconomic projections
49. 49 Example #3: Fed, Semiannual Report to Congress, 7/04
50. 50 Lag Length Selection Using Information Criteria (SW Section 14.5)
51. 51 The Bayes Information Criterion (BIC)
52. 52 Another information criterion: Akaike Information Criterion (AIC)
53. 53 Example: AR model of inflation, lags 0�6:
54. 54 Generalization of BIC to multivariate (ADL) models
55. 55 Nonstationarity I: Trends(SW Section 14.6)
56. 56 Outline of discussion of trends in time series data:
57. 57 1. What is a trend?
58. 58
59. 59
60. 60 What is a trend, ctd.
61. 61 Deterministic and stochastic trends
62. 62 Deterministic and stochastic trends, ctd.
63. 63 Deterministic and stochastic trends, ctd.
64. 64 Deterministic and stochastic trends, ctd.
65. 65 Stochastic trends and unit autoregressive roots
66. 66 Unit roots in an AR(2)
67. 67 Unit roots in an AR(2), ctd.
68. 68 Unit roots in the AR(p) model
69. 69 Unit roots in the AR(p) model, ctd.
70. 70 2. What problems are caused by trends?
71. 71 Log Japan gdp (smooth line) and US inflation (both rescaled), 1965-1981
72. 72 Log Japan gdp (smooth line) and US inflation (both rescaled), 1982-1999
73. 73 3. How do you detect trends?
74. 74 DF test in AR(1), ctd.
75. 75 Table of DF critical values
76. 76 The Dickey-Fuller test in an AR(p)
77. 77 When should you include a time trend in the DF test?
78. 78 Example: Does U.S. inflation have a unit root?
79. 79 Example: Does U.S. inflation have a unit root? ctd
80. 80 DF t-statstic = �2.69 (intercept-only):
81. 81 4. How to address and mitigate problems raised by trends
82. 82 Summary: detecting and addressing stochastic trends
83. 83 Nonstationarity II: Breaks and Model Stability (SW Section 14.7)
84. 84 A. Tests for a break (change) in regression coefficients
85. 85
86. 86 Case II: The break date is unknown
87. 87 The Quandt Likelihod Ratio (QLR) Statistic (also called the �sup-Wald� statistic)
88. 88 The QLR test, ctd.
89. 89
90. 90
91. 91 Has the postwar U.S. Phillips Curve been stable?
92. 92 QLR tests of the stability of the U.S. Phillips curve.
93. 93
94. 94 B. Assessing Model Stability using Pseudo Out-of-Sample Forecasts
95. 95 Application to the U.S. Phillips Curve:
96. 96 POOS forecasts of ?Inf using ADL(4,4) model with Unemp
97. 97 poos forecasts using the Phillips curve, ctd.
98. 98 Summary: Time Series Forecasting Models (SW Section 14.8)
99. 99 Summary, ctd.