Excel Graphs
Learn how to create bar charts, pie charts, and scatter plots in Excel for better data visualization. Understand the characteristics of good graphs and how to edit them for optimal presentation. Practice hands-on graphing techniques and data tabulation.


Excel Graphs
E N D
Presentation Transcript
Excel Graphs Lecture 7 Autumn Quarter
Topics For Today • Today – Graphs using Excel • Wednesday – Hands-on Lab: • Spot Speed Check – Traffic Engineering • Thursday – Missing Lines and Views and Orthographic Views in AutoCAD Autumn Quarter
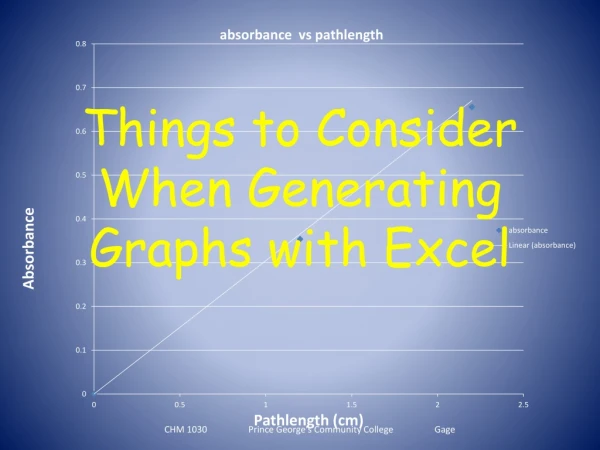
Graphs and Graphing • Types of graphs • bar charts, pie charts, scatter plots • Characteristics of good graphs • titles, axis labels, ticks, legends • plotting experimental and calculated values • Tabulating and graphing data in Excel and editing for good presentation Autumn Quarter
Types of Data • Data values can be either numeric or character • Numeric data may be either continuous orcategorical • Character data are categorical Autumn Quarter
Types of Graphs • Scatter plots are used when all variables being plotted are numeric and continuous • Bar charts and pie charts are examples of graph types in which at least one of the variables is categorical Autumn Quarter
Example: College students with jobs 270 college students were surveyed to find whether they had part-time jobs and how much they earned. Results: How can we present these data graphically? Autumn Quarter
Help! menu bar formula bar fill handle customizable toolbars currently active cell(s) Microsoft Excel - XP Autumn Quarter
Use Equations Enter Data Creating A Graph Autumn Quarter
Click the Graph Button Select Data Choose Graph Type Next Creating A Graph Autumn Quarter
More Options Next Creating A Graph Autumn Quarter
More Options Next Enter Titles Creating A Graph Autumn Quarter
Select Location Finish Creating A Graph Autumn Quarter
Creating A Graph Resize Graph As Needed Autumn Quarter
Vertical Bar Chart Autumn Quarter
Horizontal Bar Chart Autumn Quarter
Pie Chart Autumn Quarter
Scatter Plot Time (sec)Speed (rpm) 1 1210 2 1866 3 2301 4 2564 5 2742 6 2881 7 2879 8 2915 9 3010 Autumn Quarter
Use your imagination! Autumn Quarter
Editing Excel Graphs • Once a graph has been created by Excel you may need to edit a legend, title, label, etc. • Place the cursor over the item to be edited and press the right mouse button and a menu will appear (Format or Clear) • Choosing Format should allow you to edit the graph feature. Autumn Quarter
Today’s Assignment • Dwg 13 – G69 • Surface Chart with EXCEL • Due at end of class today • Dwg 14 – G71 • Pie Chart with EXCEL • Due at beginning of next lecture Autumn Quarter