Download
1 / 26
260 likes | 484 Vues
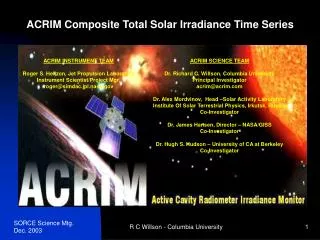
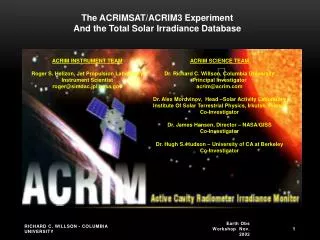
The ACRIMSAT/ACRIM3 Experiment And the Total Solar Irradiance Database. ACRIM INSTRUMENT TEAM Roger S. Helizon, Jet Propulsion Laboratory Instrument Scientist roger@simdac.jpl.nasa.gov. ACRIM SCIENCE TEAM Dr. Richard C. Willson, Columbia University Principal Investigator acrim@acrim.com

E N D
The ACRIMSAT/ACRIM3 Experiment And the Total Solar Irradiance Database ACRIM INSTRUMENT TEAM Roger S. Helizon, Jet Propulsion Laboratory Instrument Scientist roger@simdac.jpl.nasa.gov ACRIM SCIENCE TEAM Dr. Richard C. Willson, Columbia University Principal Investigator acrim@acrim.com Dr. Alex Mordvinov, Head –Solar Activity Laboratory Institute Of Solar Terrestrial Physics, Irkutsk, Russia Co-Investigator Dr. James Hansen, Director – NASA/GISS Co-Investigator Dr. Hugh S. Hudson – University of CA at Berkeley Co-Investigator Richard C. Willson - Columbia University
Status of the ACRIMSAT/ACRIM3 Experiment • Instrument status • Data quality: excellent • Sensor degradation • Total degradation of monitoring sensor < 300 ppm • Degradation calibrated with less than 10 ppm uncertainty • Less than previous ACRIM’s • Science data products • Level 0 processed and archived through end of 10/02 • Fully verified level 2 products through 10/02 • Level 2 results (10/02 version ) • Available on ACRIM3 Science Computing Facility FTP node • Awaiting LaRC/DAAC firewall interface updates and upload • Available on ACRIM.COM web site Richard C. Willson - Columbia University
TSI/Solar Active Region Feature Correlations BBSO CaK 02/15/02 MO WL 4/25/00 Richard C. Willson - Columbia University MO WL 5/19/00 MO WL 9/21/00 MO WL 3/29/01 BBSO CaK 10/12/01 BBSO WL 4/02/02 BBSO WL 7/29/02 BBSO WL 8/17/02
Comparison of Critical Operational Characteristics of Total Solar Irradiance Experiments Contributing to the precision Long Term Climate Database Richard C. Willson - Columbia University
The ACRIM NNAA3 Composite TSI Model • ACRIM NNAA3 Model: • Uses Nimbus7/ERB, ACRIM1,2,3 results • Normalized to ACRIM3 scale using an overlapping chain of comparisons • ACRIM1/ACRIM2 ratio derived from NIMBUS7/ERB comparisons Richard C. Willson - Columbia University
The ACRIM NNAVA3 Composite TSI Model • ACRIM NNAVA3 Model: • Uses Nimbus7/ERB, ACRIM1,2,3 and VIRGO results • Normalized to ACRIM3 scale using an overlapping chain of comparisons • ACRIM1/ACRIM2 ratio derived from NIMBUS7/ERB comparisons • VIRGO results after 1998 SOHO hiatus not used (depend on ACRIM2) Richard C. Willson - Columbia University
Degradation of ACRIM2 and ACRIM3 Experiments Richard C. Willson - Columbia University
Degradation of the SOHO/VIRGO Experiment PMO6V-A Degradation + 1200 ppm 0 ppm ‘Summer Vacation’ - 1600 ppm ‘Winter Vacation’ Richard C. Willson - Columbia University
The Composite TSI Model Dilemma:Relate ACRIM1 and ACRIM2 using Nimbus7/ERB or ERBS (?) Richard C. Willson - Columbia University
Comparison of Nimbus7/ERB and ERBS results – ACRIM1 period Richard C. Willson - Columbia University
Comparison of Nimbus7/ERB and ERBS results Richard C. Willson - Columbia University
Comparison of TSI Observationsduring ACRIM1, ACRIM Gap and ACRIM2 Periods Richard C. Willson - Columbia University
Reconciliation of TSI Trend Difference Between Models UsingNimbus7/ERB and ERBS ACRIM Comparisons • ERBS degradation during 1989 – 1991 ‘ACRIM gap’ equals difference in trend of TSI models (within uncertainty of comparisons) • Probable cause: uncorrected degradation of ERBS during activity maximum of solar cycle 22 • TSI sensors degrade faster during solar maxima due to enhanced short wavelength fluxes • ERBS sensors likely more prone to degradation than Nimbus7/ERB’s due to different prior exposure histories Richard C. Willson - Columbia University
The ‘PMOD’ (Frohlich-Lean ) Composite TSI Model • Uses results from Nimbus7/ERB, ACRIM and VIRGO experiments • Relates ACRIM1 to ACRIM2 using ERBS • Requires that Nimbus7/ERB conform to ERBS during ACRIM gap Adjusts Nimbus7/ERB by -0.04 % during ACRIM gap Uses TSI solar proxy model to justify use of ERBS as reference • Requires conformance to a TSI/Solar Proxy model during solar maxima • Adjusts Nimbus7/ERB results downward during solar cycle 21 maximum • Adjusts ACRIM1 results downward during solar cycle 21 maximum Richard C. Willson - Columbia University
Comparison of ACRIM & PMOD composite TSI modelsand the Greenwich Sunspot Numbers Richard C. Willson - Columbia University
Comparison of ACRIM & PMOD composite TSI modelsand the Greenwich Sunspot Numbers Richard C. Willson - Columbia University
Comparison of ACRIM and PMOD TSI Composite Models • ACRIM – PMOD minimum-to-minimum trend • Difference = 0.04 %/decade • PMOD’s Nimbus7/ERB ‘ACRIM gap’ adjustment = - 0.04 % • Difference appears to be an artifact of PMOD adjustment of Nimbus7/ERB • Downward trend of solar activity maxima during cycles 21 – 23 • Correlates with ACRIM composite TSI • Does not correlate with PMOD composite TSI • ACRIM ‘observational’ model: Uses unmodified published experimental results Uses Nimbus7/ERB as the reference across the ‘ACRIM gap’ • PMOD ‘TSI/Solar Proxy’ model: Modifies published experimental results to conform to TSI/Solar Proxy models Uses ERBS as the reference across the ‘ACRIM gap’ Richard C. Willson - Columbia University
Limitations of TSI/Solar-Proxy Models • Proxy models are based on statistical regressions of TSI observations against solar activity or radiative proxies • Solar proxy indices are ground-based observations an order of magnitude less precise and accurate than satellite TSI observations • Relationship between solar proxies and TSI not well understood on a quantitative physical basis • Proxy models are useful for qualitative studies of historical climate and solar activity relationships • Proxy models cannot provide quantitative support at the level of precision or accuracy required for a climate database for: • selecting TSI observations • making detailed adjustments • predicting TSI Richard C. Willson - Columbia University
Climate Varies in Direct Proportion to Solar Magnetic Activity • Climate and solar activity variations during past millenium • Climate observations Proxy: agriculture, freezing rivers, glacier and sea ice growth/retreat Direct: temperature, ice and sea level measurements, δ18O (recent) • Solar activity observations Proxy: 14C, 10Be, aurora sightings, visible sunspots Direct: Solar astronomy (recent) Figure credit: Jack Eddy Richard C. Willson - Columbia University
Climate, Total Solar Irradiance And Monitoring Requirements • Climate and TSI are positively related • Correlated through mutual relationships with solar magnetic activity • Little Ice Age climate minima may have required only 0.25 % TSI decreases • Observational requirements are therefore: • Maintain precision small compared to 0.25 % on century-length time scales Uncertainty of ambient temperature TSI sensors ~ 0.1 % in SI Instrument level precision can be ~ 5 ppm/yr • Overlap strategy required for TSI monitoring • Absolute calibration at 0.01 % required for validation of monitoring experiments Richard C. Willson - Columbia University
A Science & Cost Effective TSI Monitoring Strategy • Redundant ambient temperature satellite TSI monitors • TSI experiment redundancy is only reason we have a 2 decade database today • Overlap for relative calibrations at precision level • Ambient temperature radiometers are cost effective • 5 ppm/yr precision achievable using 3 sensor redundancy, ACR-type modality • Periodic calibration by a shuttle-based cryogenic radiometer • LHe temperature ACRis only demonstrated approach with 0.01 % SI uncertainty • Calibrate scale and degradation of ambient temperature TSI monitors • Compiles independent long term TSI record for climate • Shuttle flight using expendable cryogen is cost effective approach • Use of ‘GASCAN’ minimizes cost and maximizes flight opportunities Richard C. Willson - Columbia University
Potential ACRIM contributions to TSI Monitoring Strategy • Components for two ACRIM3 flight instruments exist in JPL/ACRIM inventory • Instrument technology flight proven in ACRIMSAT/ACRIM3 experiment • ACRIM3 design readily adaptable to a variety of flight opportunities • JPL ground station and operational infrastructure in place for smallsat modality • Science Team infrastructure, algorithm, SCF and DAAC archiving developed • Shuttle-based cryogenic radiometer concept • Informal exploration of ACRIM/NIST LHe cryogenic radiometer design has begun • Synthesis of ACRIM and NIST technologies would provide state of the art • Traceability to NIST LHe radiometric standards would be provided • Shuttle implementation is well within current state of the art • Shuttle may be only flight opportunity for realization of 0.01 % SI TSI uncertainty • Utilization of the ‘GASCAN’ accomodation approach is feasible Maximizes limited flight opportunities Cost-effective Richard C. Willson - Columbia University
Extrinsic TSI Variation: Annual Earth Orbital TSI Variation • Solar rotation axis inclined 7.25 deg. from normal to Earth's orbital plane • View of Sun's northern hemisphere a maximum in September, southern in March • Signature of north/south active region asymmetry seen in wavelet analysis of composite TSI – particularly around maximum of solar cycle 22 (1988 – 1994) • Feature diminishes at solar minimum due to paucity of active regions Figure credit: Dr. A. V. Mordvinov Richard C. Willson - Columbia University