Download
1 / 10
100 likes | 274 Vues
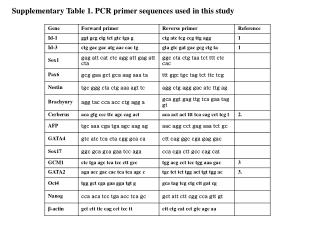
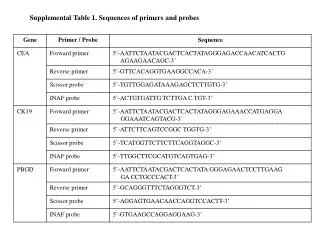
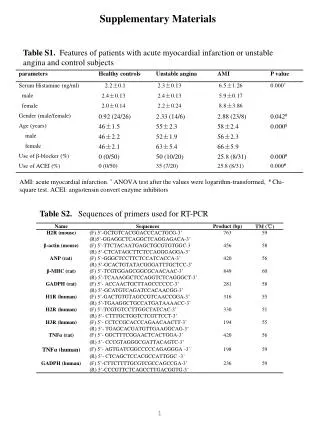
Supplemental Table 1. Supplemental Table 1. Primer sequences for cloning and real-time RT-PCR of miRNA precursors. Supplemental Table 2. Supplemental Table 2. Primer sequences for detection of mature miRNAs. Supplemental Table 3.

E N D
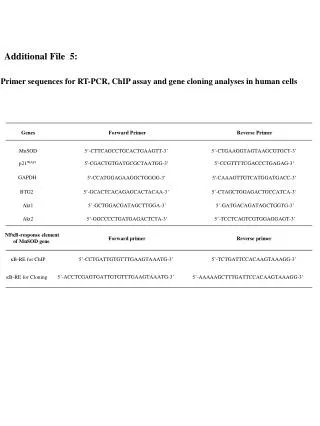
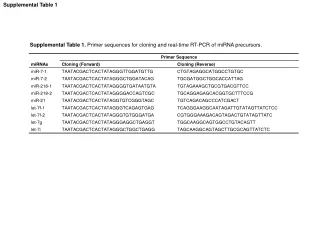
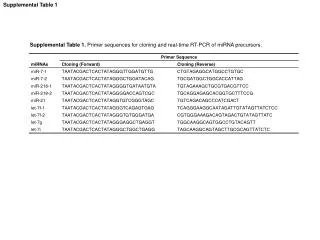
Supplemental Table 1 Supplemental Table 1. Primer sequences for cloning and real-time RT-PCR of miRNA precursors.
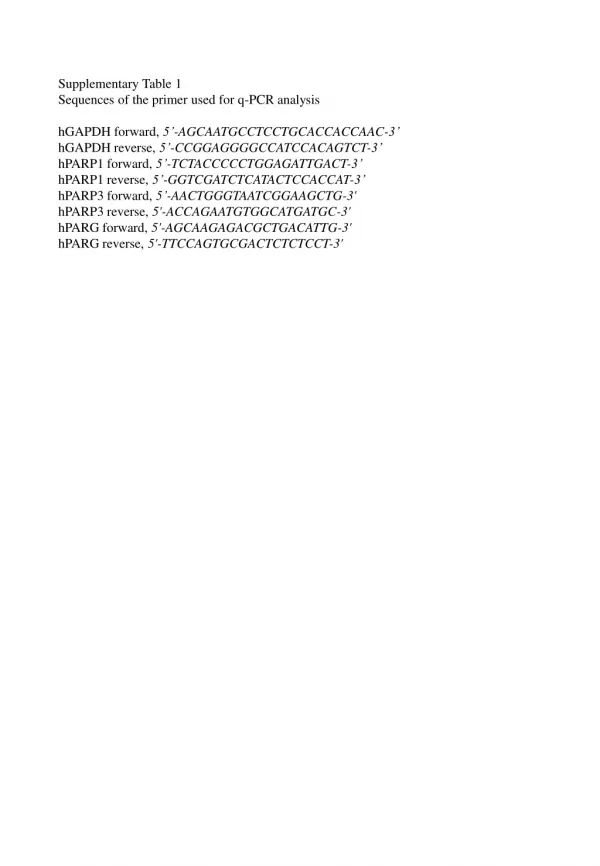
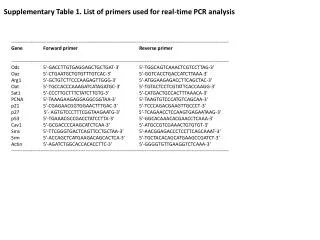
Supplemental Table 2 Supplemental Table 2. Primer sequences for detection of mature miRNAs.
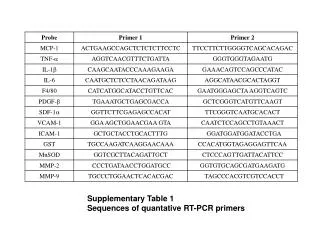
Supplemental Table 3 Supplemental Table 3. Comparison of stem-loop and linear RT oligonucleotides. The most stable secondary structure was adopted to calculate ∆G for linear RT oligonucleotides. Sequence differences between stem-loop and linear RT oligonucleotides for each miRNA are underlined.
Supplemental Fig. 1 Assay Design Flowchart Example (hsa-miR-21) hsa-miR-21: 5’- uagcuuaucagacugauguuga -3’ Extract mature miRNA sequence (seq) RT Oligonucleotide: miR-21 specific seq (RT) • Design RT oligonucleotide • 5’ stem-loop tag seq (stem: 5-6nt; loop: ~11nt) without significant homology to sequences from species of interest (eg. homo sapiens) • 3’ miRNA-specific seq (6nt, reverse complementary to 3’ of miRNA sequence) • Optionally, dU residue can be incorporated in the loop region. 5’- CACCGTTCCCCGCCGTCGGTGTCAACA -3’ (dU) Stem loop Stem 5’- Evaluate RT oligonucleotide (mfold) Formation of stable stem-loop secondary structure at RT condition (∆G -0.5 kcal/mol) Does not form stable stem-loop secondary structure at PCR condition (∆G -0.5 kcal/mol) -3’ ∆GRT = -2.37 kcal/mol ∆GPCR = 0.19 kcal/mol (dU) Design hemi-nested real-time PCR primer Forward primer (Tm 58°C) with 5’ tag seq to increase Tm and 3’ miRNA specific seq (~12nt) Reverse primer (Tm 58°C) with partial stem-loop tag seq (8-10nt) and miRNA specific seq (9-11nt, including 6nt used in RT and 3-5nt 3’ protruding seq). Forward Primer: 5’- CCCGCCTAGCTTATCAGACTG -3’ Tag seq miR-21 specific seq Reverse Primer: 5’- GCCGTCGGTGTCAACATCA -3’ Reaction Conditions RT: Na+ = 75 mM, Mg2+ = 3 mM, Temp = 42°C PCR: Na+ = 50 mM, Mg2+ = 2.5 mM, Temp = 60°C Partial stem-loop tag seq (RT) (Hemi-nested PCR) miR-21 specific seq Supplemental Fig. 1. Flow Chart and example for designing hemi-nested real-time RT-PCR assay.
Supplemental Fig. 2 A B let-7d let-7e Supplemental Fig. 2. Quantification of synthetic let-7d and let-7e miRNA dilutions with U251 total RNA spike-in. Standard dilutions (109, 108 and 107 copies) of synthetic let-7d (A) or let-7e (B) were spiked with 100 ng of total RNA isolated from U251 cells. Control miRNA dilutions or total RNA spiked-in miRNA dilutions were reverse transcribed with let-7d or let-7e RT primers. The cDNA samples (10% v/v) were amplified by real-time PCR. Standard curves were plotted as Ct versus Log (Copies of miRNA per RT).
Supplemental Fig. 3 A B miR-24 NTC 109 103 C D miR-92 NTC 109 103 E F miR-218 NTC 1010 104 Supplemental Fig. 3. Dynamic range and efficiency of miR-24 (A, B), miR-92 (C, D) and miR-218 (E, F) real-time RT-PCR assays. Standard dilutions of synthetic miR-24, -92 and -218 were reverse transcribed with miRNA-specific RT oligonucleotide. The cDNA samples (10% v/v) were amplified by real-time PCR along with non-template control (NTC). Amplification plots (A, C, E) and standard curves (B, D, F) of the assay were shown. Standard curves were plotted as Ct versus Log (Copies of miRNA per RT).
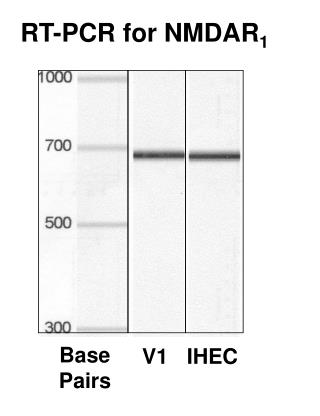
Supplemental Fig. 4 miR-7 miR-21 miR-218 let-7f let-7g let-7i M U6 a b c a b c a b c a b c a b c a b c 100bp 50bp 25bp Supplemental Fig. 4. Gel electrophoresis of miRNA real time RT-PCR products. Real time RT-PCR assays were performed with 106 copies of synthetic miRNA (a), 10 ng U251 total RNA (b) or non-template control (c). U6 was amplified from 10 pg of U251 total RNA. The amplified products and the 25bp marker (M) were resolved by 4% agarose gel. Product sizes: miR-7 (37bp), miR-21 (38bp), miR-218 (36bp), let-7f (45bp), let-7g (42bp), let-7i (38bp) and U6 (94bp).
Supplemental Fig. 5 A B C – UDG – UDG dT dU + UDG + UDG + Pr + Pr – Pr – Pr Supplemental Fig. 5. UDG treatment of dU-incorporated RT oligonucleotide prevented it from serving as PCR primer after RT. A) Sequence of standard (dT) and dU-incorporated (dU) RT oligonucleotides for miR-21. Synthetic miR-21 (109 copies) were reverse transcribed with of dT (B) or dU (C) RT oligonucleotides. The cDNA samples (10% v/v) were then treated with (red amplification curves) or without UDG (blue amplification curves) and subjected to real-time PCR with both forward and reverse primers (+ Pr) or forward primer alone (- Pr).
Supplemental Fig. 6 A 0 5 15 30 60 180 360 GDNF (min) Phospho-ERK1/2 Total ERK1/2 B - - - + + + U0126 (5 µM) 0 5 15 0 5 15 GDNF (min) Phospho-ERK1/2 Total ERK1/2 Supplemental Fig. 6. GDNF-induced signaling activation in U251 human glioblastoma cells. Control and GDNF stimulated U251 cells were lysed with 2% SDS. Total protein lysates were quantified using microBCA protein assay (Pierce, Rockford, IL, USA). Total protein (10 µg) were separated by SDS-PAGE and probed with antibodies against phospho-ERK1/2 (Cell Signaling Technologies, Danvers, MA, USA). The blots were striped in Western Blot Stripping Buffer (Pierce) and re-probed with total ERK1/2 (Cell Signaling Technologies) to verify equal loading. Chemiluminescence was imaged and analyzed by ChemiDoc system (Bio-Rad). A) Time-course of ERK1/2 MAPK activation by GDNF (100 ng/ml) in U251 cells. B) GDNF-induced ERK1/2 MAPK activation was inhibited by pre-treatment of MEK inhibitor U0126 (5 µM).
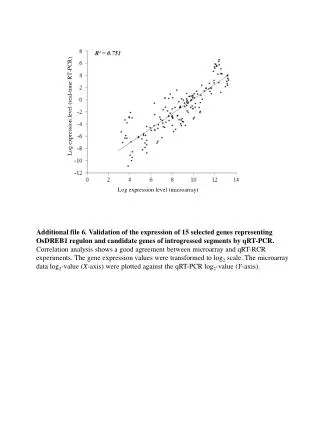
Supplemental Fig. 7 A B miR-218 let-7i Fold Change Fold Change Time (min) Time (min) Supplemental Fig. 7. Quantification of GDNF-regulated miRNAs by single-plexed and multiplexed real-time RT-PCR. Total U251 RNA samples were reverse transcribed by single miRNA-specific RT oligonucleotide (black lines) or 24-plexed RT oligonucleotides (red lines). The cDNA samples were then quantified for expressions of (A) miR-218 and (B) let-7i. Regulation of these miRNAs was expressed as fold changes to non-stimulated control samples.