Download
1 / 4
60 likes | 164 Vues
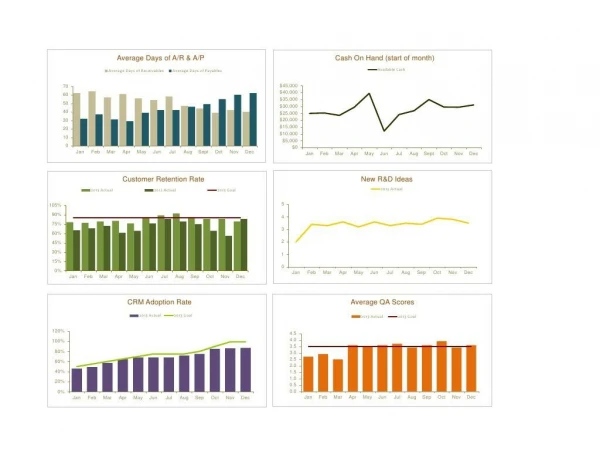
Customize this fully editable dashboard presentation slide to suit your needs and engage your audience effectively. Edit colors, icons, and charts easily in PowerPoint.

E N D
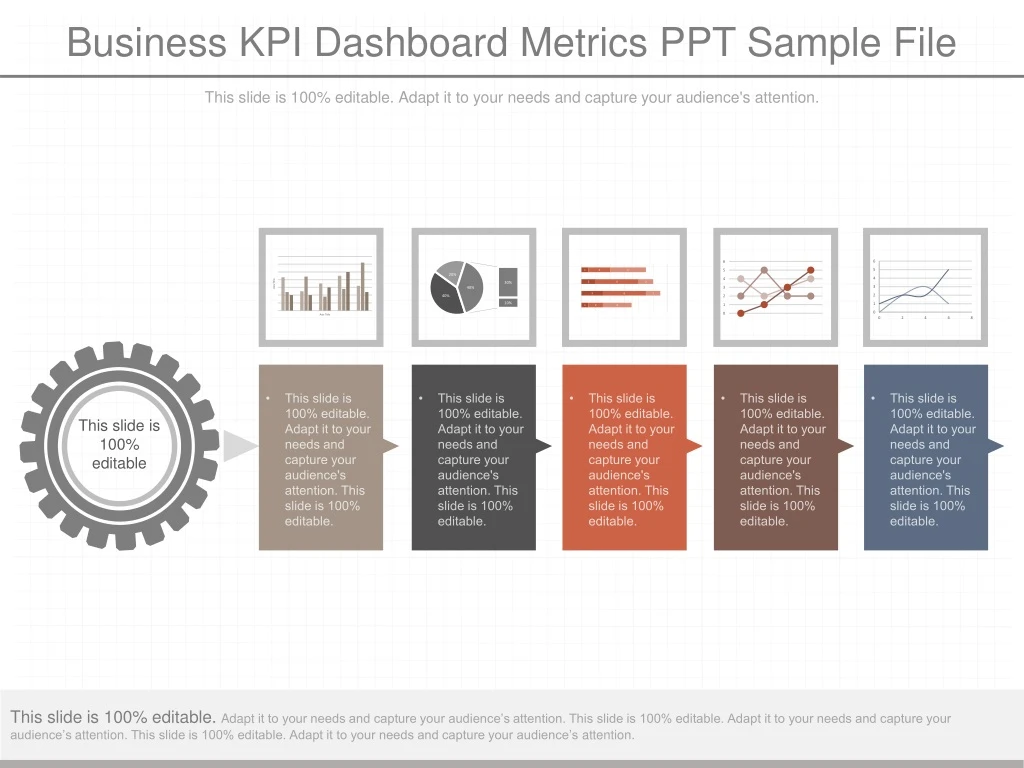
Business KPI Dashboard Metrics PPT Sample File This slide is 100% editable. Adapt it to your needs and capture your audience's attention. This slide is 100% editable • This slide is 100% editable. Adapt it to your needs and capture your audience's attention. This slide is 100% editable. • This slide is 100% editable. Adapt it to your needs and capture your audience's attention. This slide is 100% editable. • This slide is 100% editable. Adapt it to your needs and capture your audience's attention. This slide is 100% editable. • This slide is 100% editable. Adapt it to your needs and capture your audience's attention. This slide is 100% editable. • This slide is 100% editable. Adapt it to your needs and capture your audience's attention. This slide is 100% editable. This slide is 100% editable. Adapt it to your needs and capture your audience’s attention. This slide is 100% editable. Adapt it to your needs and capture your audience’s attention. This slide is 100% editable. Adapt it to your needs and capture your audience’s attention.
All images are 100% editable in PowerPoint “Change color, size and orientation of any icon to your liking”
Edit Color 1 2 3 Select the shape to change the color and Right click the object( click any object which you want to change color) Choose Format Data Series in the dialog box. Choose “Fill” in the Format Shape box then “Solid” or “Gradient” depending on the appearance of the object. Change colour as shown in the picture.
Edit Chart This is a Data Driven Chart/Graph and the shape automatically adjusts according to your data 1 2 3 1. Select the Graph and right click -> Select "Edit Data" 2. An excel matrix will automatically show up 3. Enter the values based on your requirements and hit enter 4. The Graph/Chart shape will automatically adjust according to your data, and anytime you can go and change the value again