Medical Imaging
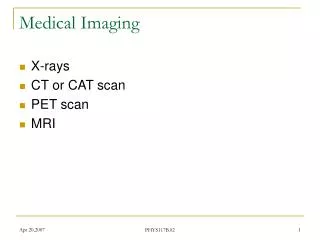
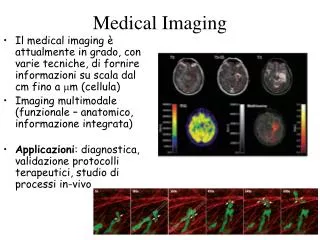
Medical Imaging. Mohammad Dawood Department of Computer Science University of Münster Germany. Image Segmentation. Segmentation - Locate tumors and other pathologies - Measure tissue volumes - Computer-guided surgery - Diagnosis - Treatment planning


Medical Imaging
E N D
Presentation Transcript
Medical Imaging Mohammad Dawood Department of Computer Science University of Münster Germany
Segmentation • - Locate tumors and other pathologies • - Measure tissue volumes • - Computer-guided surgery • - Diagnosis • - Treatment planning • - Study of anatomical structure
Segmentation Histogram based segmentation
Segmentation Histogram based segmentation
Segmentation Zack Method A line is constructed between the maximum of the histogram at brightness bmax and the lowest value bmin The distance d between the line and the histogram h[b] is computed for all values of b from b = bmin to b = bmax The brightness value bo where the distance between h[bo] and the line is maximal is the threshold value.
Segmentation • Global Threshold Selection • Select an initial threshold (T) • Segment into object and background • G1 = {f>=T} • G2 = {f< T} • The average of each set is • m1 = average value of G1 • m2 = average value of G2 • New threshold is average of m1 and m2 • T’ = (m1 + m2)/2. • - Repeat until convergence
Segmentation • Global Threshold Selection • Threshold = 153.1063
Segmentation • Otsu’s Method • Compute histogram • For all possible thresholds t • Calculate ωi and μi • Compute variance: ω1(t) *ω2 (t) [μ1(t)- μ2(t)] • Desired threshold corresponds to the maximum • Threshold for the Head Image: 153.0
Segmentation Multiple Thresholds (f < 90) + (f>180)
Segmentation K-Means Clustering - Pick K cluster centers - Assign each pixel in the image to the nearest cluster center - Re-compute the cluster centers by averaging all pixels in the cluster - Repeat until convergence
Segmentation K-Means Clustering K-Means Fuzzy K-Means
Segmentation Region Growing - Select seeding points - Starting from seeds, look at the neighbors if neighbor similar, add to region else proceed with next unclassified neighbor - Repeat until all pixels are classified
Segmentation Region Growing Threshold 10 Threshold 20
Segmentation • Watersheds • Image is visualized in 3 dimensions • - 2 spatial dimensions • - grey levels • Three parts: • - points belonging to regional minimum • - catchment area • - dividing lines or watershed lines
Segmentation • Watersheds • Label each minimum with a distinct label. Initialize a set S with the labeled nodes • Extract from S a node x of minimal altitude F Attribute the label of x to each non labeled node y adjacent to x, and insert y in S • Keep the catchment areas separated by dams • Repeat until S is empty.
Segmentation Watersheds