2008 World Population Data Sheet
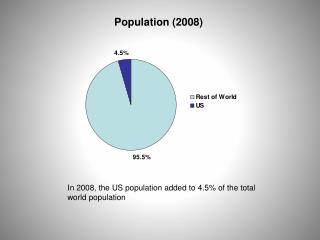
2008 World Population Data Sheet Global Demographic Divide Widens Presentation by Bill Butz, Carl Haub, Richard Skolnik, and Linda Jacobsen of the Population Reference Bureau August 19, 2008 Developing Regions Make Up an Increasing Share of World Population.

2008 World Population Data Sheet
E N D
Presentation Transcript
2008 World Population Data Sheet Global Demographic Divide Widens Presentation by Bill Butz, Carl Haub, Richard Skolnik, and Linda Jacobsen of the Population Reference Bureau August 19, 2008 © 2008 POPULATION REFERENCE BUREAU
Developing Regions Make Up an Increasing Share of World Population. World Population (in Billions): 1950-2050 Source: United Nations Population Division, World Population Prospects: The 2006 Revision. © 2008 POPULATION REFERENCE BUREAU
More Developed Countries Have Fewer Young People Relative to Elderly. Population by Age and Sex, More Developed Countries: 2008 Source: United Nations Population Division, World Population Prospects: The 2006 Revision. © 2008 POPULATION REFERENCE BUREAU
Less Developed Countries Have More Young People Relative to Elderly. Population by Age and Sex, Less Developed Countries: 2008 Source: United Nations Population Division, World Population Prospects: The 2006 Revision. © 2008 POPULATION REFERENCE BUREAU
Italy and the Democratic Republic of the Congo (formerly Zaire) Illustrate the Demographic Divide in 2008. Source: Carl Haub and Mary Mederios Kent, 2008 World Population Data Sheet. © 2008 POPULATION REFERENCE BUREAU
Every Country Has a Different Pattern of Fertility Decline. Fertility Patterns for Selected Countries: 1950-2010 Sources: United Nations Population Division, World Population Prospects: The 2006 Revision; Population Reference Bureau; and Korea National Statistics Office. © 2008 POPULATION REFERENCE BUREAU
What Do Global Population Projections Assume? “Realization of the medium variant projections contained in the 2006 Revision is also contingent on ensuring that fertility continues to decline in developing countries…To achieve such reductions, it is essential that access to family planning expands in the poorest countries of the world.” Source: United Nations Population Division, World Population Prospects: The 2006 Revision. © 2008 POPULATION REFERENCE BUREAU
Just as Fertility Patterns Differ, So Do Those of Contraceptive Use. Percent of Married Women Using Contraception, Selected Countries N.A. – Data not available. Sources: Demographic and Health Surveys and United Nations Population Division. © 2008 POPULATION REFERENCE BUREAU
Few Statistics Show Cross-Regional Gaps in Health Care as Does Maternal Mortality. A Woman’s Lifetime Risk of Dying from a Pregnancy-Related Cause: 2005 1 Excludes non-Baltic republics of the former Soviet Union. 2 Excludes Sudan. Source: WHO, UNICEF, UNFPA, and the World Bank, Maternal Mortality in 2005: Estimates Developed by WHO, UNICEF, UNFPA, and the World Bank. © 2008 POPULATION REFERENCE BUREAU
Many People Lack Required Calories. Percent of Population Consuming Less Than Required Number of Calories, 2002-2004 Source: United Nations Food and Agriculture Organization, Statistics Division. © 2008 POPULATION REFERENCE BUREAU
Mother’s Education Is A Key to Children’s Nutritional Status. Percent of Children Under Age 3 Who Are Stunted, by Mother’s Education Source: Demographic and Health Surveys. © 2008 POPULATION REFERENCE BUREAU
Stunting Can Be Addressed. • Focus on children from conception to 2 years of age. • Promote exclusive breastfeeding and appropriate complementary foods. • Encourage community-based approaches to better feeding and caring. • Reduce infection. • Ready-to-use foods are promising in some settings. • Conditional cash transfers also show promise. © 2008 POPULATION REFERENCE BUREAU
The Countries With the Least Access to an Improved Water Source Have Among the World’s Fastest-Growing Populations. Source: Carl Haub and Mary Mederios Kent, 2008 World Population Data Sheet. © 2008 POPULATION REFERENCE BUREAU
The United States Has Been Growing Faster Than Expected. United States Population (in Millions): 1970-2050 Source: Population Reference Bureau, analysis of data from U.S. Census Bureau. © 2008 POPULATION REFERENCE BUREAU
Continued Population Growth Sets the United States Apart From Other Developed Countries Around the World. Percent Change in Population, Selected Countries: 2008-2050 Source: Carl Haub and Mary Mederios Kent, 2008 World Population Data Sheet. © 2008 POPULATION REFERENCE BUREAU
By 2050, One in Every Five Americans Will Be Age 65 or Older. Percent of U.S. Population in Selected Age Groups: 1970-2050 Source: Population Reference Bureau, analysis of data from U.S. Census Bureau. © 2008 POPULATION REFERENCE BUREAU
The United States Will Continue to Become More Racially and Ethnically Diverse. Percent of U.S. Population by Race and Ethnicity: At 300 Million and 400 Million * Excludes Hispanics. Source: Population Reference Bureau, analysis of data from U.S. Census Bureau. © 2008 POPULATION REFERENCE BUREAU
Ten Percent of U.S. Counties Have Already Reached Majority-Minority Status. Counties at or Nearing Majority-Minority Status (Total Population), United States: 2007 Source: Population Reference Bureau, analysis of data from U.S. Census Bureau. © 2008 POPULATION REFERENCE BUREAU
Minorities Make Up at Least 50 Percent of the Youth Population in One in Seven Counties Nationwide. Counties at or Nearing Majority-Minority Status (Under-20 Population), United States: 2007 Source: Population Reference Bureau, analysis of data from U.S. Census Bureau. © 2008 POPULATION REFERENCE BUREAU
The Current Generation Gap in Racial-Ethnic Diversity Will Gradually Decrease by 2050. Percent of the U.S. Population That Is Minority, by Age Group: 2007-2050 Source: Population Reference Bureau, analysis of data from U.S. Census Bureau. © 2008 POPULATION REFERENCE BUREAU
Global Demographic Divide Widens 2008 World Population Data Sheet Presentation by Bill Butz, Carl Haub, Richard Skolnik, and Linda Jacobsen of the Population Reference Bureau August 19, 2008 © 2008 POPULATION REFERENCE BUREAU