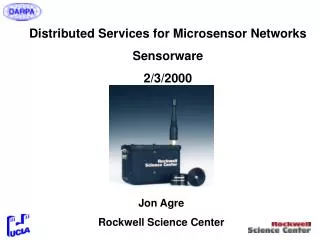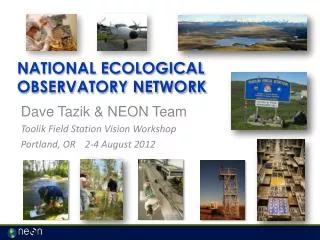
PODS: an Ecological Microsensor Network
PODS: an Ecological Microsensor Network. Edo Biagioni, ICS Kim Bridges, Botany Brian Chee, ICS and many more!. Overview. Introduction Interpreting Spatial and Temporal Environmental Information Early Deployment Technical Details: Wireless Communications and Routing. Part 1.


PODS: an Ecological Microsensor Network
E N D
Presentation Transcript
PODS: an Ecological Microsensor Network Edo Biagioni, ICS Kim Bridges, Botany Brian Chee, ICS and many more!
Overview • Introduction • Interpreting Spatial and Temporal Environmental Information • Early Deployment • Technical Details: Wireless Communications and Routing
Part 1 Interpreting Spatial and TemporalEnvironmental Information
The Challenge • Endangered plants grow in few locations • Hawai'i has steep weather gradients: the weather is different in nearby locations • A single weather station doesn’t help, so • Have many sensors (PODS) • Make them unobtrusive: rock or log • Resulting in lots of data
Data Collection • Wind, Rain, Temperature, Light, Moisture • At each pod • Every 5 minutes to 1 hour, for years • Images at some of the pods • Networking challenge: getting the data back without discharging the batteries • How to make sense of all this data?
Spatial Patterns • Wet and dry areas have different plants • Cold and warm areas have different plants • Where is the boundary? The boundary will be different for different plant species • Does cloud cover matter? • Does wind matter? Pollinators, herbivores
Temporal Patterns • Is this a warm summer? Winter? • Is it a warm summer everywhere, or just in some places? • Does it rain more when it is warmer? • What events cause flowering? • How long does it take the plant to recover after an herbivore passes?
Who needs the Information? • Scientists (botanists) • High-School Students • Virtual Tourists • Farmers
What use is the Information? • Study the plants, prevent decline • Determine what is essential for the plant’s survival: e.g., how will global warming affect it? • Locate alternative areas • Watch what happens, instead of trying to reconstruct what happened • Capture rare phenomena
How is the data communicated? • Graphs, maps, tables • Tables unwieldy for large numbers of PODS • Graphs need many different scales • Maps can help intuitive understanding • Ultimately, need to find useful patterns
Picture of weather data, from web • http://weather.yahoo.com/graphics/satellite/east_usa.html
Simple Map Blue: rain Big Blue: recent rain Cyan: cool, dry Red: warm, dry http://red2.ics.hawaii.edu/cgi-bin/location
Graphs Good for recognition of temporal patterns Can summarize a lot of data very concisely Mostly for homogeneous data Maps Good for recognition of spatial patterns Can summarize a lot of data very concisely Good for heterogeneous data Graphs vs. Maps
Strategies • Data Mining: search data for patterns, try to match to plant distribution • Machine Learning: try to predict new data. If prediction is wrong, something unpredicted (unpredictable!) is happening • Better maps, incorporating lots of data including images, but in a way that supports intuitive analysis
Better Map Blue: rain Red: temperature Yellow: sunlight Plant population Not (yet) automated on the web…
Where to go from here • Plant “surveillance”: being there, remotely • Data Collection is only the essential first step • Data Analysis must be supported by appropriate tools • Find out what really matters in the life of an endangered plant
Part 2: Early Deployment • Deployment of hybrid PODS • Computer, radio, and some sensors built by a team at MIT • Enclosures, most sensors, and power built by UH pods team
September October November December January February March April May June July Complementary activities Contact regarding a joint test Design Manufacturing Field deployment Redesign & manufacturing Lab testing Redeployment Field testing
MIT Media Lab Computer Radio Network Software TephraNet UH PODS Enclosures Sensors Power Field Site (Study Problem)
Hawaii VolcanoesNational Park Hawaii VolcanoesObservatory Kilauea Crater Halemaumau SouthwestRift Zone Chain of Craters Highway
Rainforest Rainfall Gradient Desert
Hawaii VolcanoesObservatory Silene Study Area Southwest Rift Zone
light wind (bend) temperature Computer& Radio humidity Batteries Rock Enclosures Internal: voltage
Michael Lurvey rockmaker Inner mold: Latex & gauze Outer mold: Plaster of Paris Casting: pretinted “bondo”
Hawaii VolcanoesObservatory Silene Study Area Southwest Rift Zone
300 feet 6 to 10 feet 100 feet
Computer& Radio light `Ohia BranchEnclosures Batteries foam spacer temperature
6” PVC pipe Laser-printed texture Waterproof spray coating “Bondo” caps
Transmission directions comm distance Deployment Layout Redundancy considerations
Deployment Positioning Accuracy ~20 feet Wide Area Augmentation System
HawaiiVolcanoes Observatory FieldDeployment Silene hawaiiensis
Recent Lessons Keep it small! Manufacturing, shipping, deployment
1 2 3 March 2001 4 5 6 7 8 9 10 11 12 13 14 15 16 17 18 19 20 21 22 23 24 25 26 27 28 29 30 31 Working against a deadline is important