Download
1 / 15
150 likes | 238 Vues
This lecture covers known distributions such as Normal, Student’s t, F, and χ2. Explore properties and usage of the standard normal curve (Z-table), converting distributions to standardized normal, and calculating probabilities under the curve.

E N D
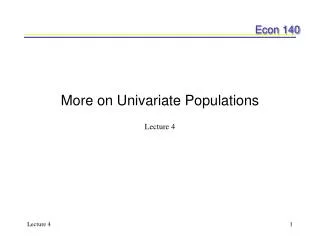
More on Univariate Populations Lecture 4
Today’s Plan • Examining known distributions: • Normal distribution & Standard normal curve • Student’s t distribution • F distribution & c2 distribution • Note: should have a handout for today’s lecture with all tables and a cartoon
Standard Normal Curve • We need to calculate something other than our PDF, using the sample mean, the sample variance, and an assumption about the shape of the distribution function • Examine the assumption later • The standard normal curve (also known as the Z table) will approximate the probability distribution of almost any continuous variable as the number of observations approaches infinity
68% area under curve 95% 99.7% Standard Normal Curve (2) • The standard deviation (measures the distance from the mean) is the square root of the variance:
Standard Normal Curve (3) • Properties of the standard normal curve • The curve is centered around • The curve reaches its highest value at and tails off symmetrically at both ends • The distribution is fully described by the expected value and the variance • You can convert any distribution for which you have estimates of and to a standard normal distribution
Standard Normal Curve (4) • A distribution only needs to be approximately normal for us to convert it to the standardized normal. • The mass of the distribution must fall in the center, but the shape of the tails can be different or
Standard Normal Curve (5) • If we want to know the probability that someone earns at most $C, we are asking: We can rearrange terms to get: • Properties for the standard normal variate Z: • It is normally distributed with a mean of zero and a variance of 1, written in shorthand as Z~N(0,1)
Standard Normal Curve (5) • If we have some variable Y we can assume that Y will be normally distributed, written in shorthand as Y~N(µ,2) • We can use Z to convert Y to a normal distribution • Look at the Z standardized normal distribution handout • You can calculate the area under the Z curve from the mean of zero to the value of interest • For example: read down the left hand column to 1.6 and along the top row to .4 you’ll find that the area under the curve between Z=0 and Z=1.64 is 0.4495
Z1 Z2 P(300Y 400) Standard Normal Curve (6) • Going back to our earlier question: What is the probability that someone earns between $300 and $400 [P(300Y 400)]?
Z1 Z2 P(253Y 316) Standard Normal Curve (7) • We know from using our PDF that the chance of someone earning between $300 and $400 is around 23%, so 0.24 is a good approximation • Now we can ask: What is the probability that someone earns between $253 and $316?
Standard Normal Curve (8) • There are instructions for how you can do this using Excel: L4_1.xls. Note how to use STANDARDIZE and NORMDIST and what they represent • Our spreadsheet example has 3 examples of different earnings intervals, using the same distribution that we used today • Testing the Normality assumption. We know the approximate shape of the Earnings (L3_79.xls) distribution. Slightly skewed. Is normality a good assumption? Use in Excel (L4_2.xls) of NORMSINV
Student’s T-Distribution • Starting next week, we’ll be looking more closely at sample statistics • In sample statistics, we have a sample that is small relative to the population size • We do not know the true population mean and variance • So, we take samples and from those samples we will estimate a mean and variance SY2
T-Distribution Properties • Fatter tails than the Z distribution • Variance is n/(n-2) where n is the number of observations • When n approaches a large number (usually over 30), the t approximates the normal curve • The t-distribution is also centered on a mean of zero • The t lets us approximate probabilities for small samples
F and c2 Distributions • Chi-squared distribution:square of a standard normal (Z) distribution is distributed c2 with one degree of freedom (df). • Chi-squared is skewed. As df increases, the c2 approximates a normal. • F-distribution: deals with sample data. F stands for Fisher, R.A. who derived the distribution. F tests if variances are equal. • F is skewed and positive. As sample sizes grow infinitely large the F approximates a normal. F has two parameters: degrees of freedom in the numerator and denominator.
What we’ve done • The probability of earning particular amounts • Relationship between a sample and population • Using standard normal tables • Introduction to the t-distribution • Introduction to the F and c2 distributions • In the next lectures we’ll move on to bivariate populations, which will be important for computing conditional probability examples such as P(Y|X)