Download
1 / 12
120 likes | 237 Vues
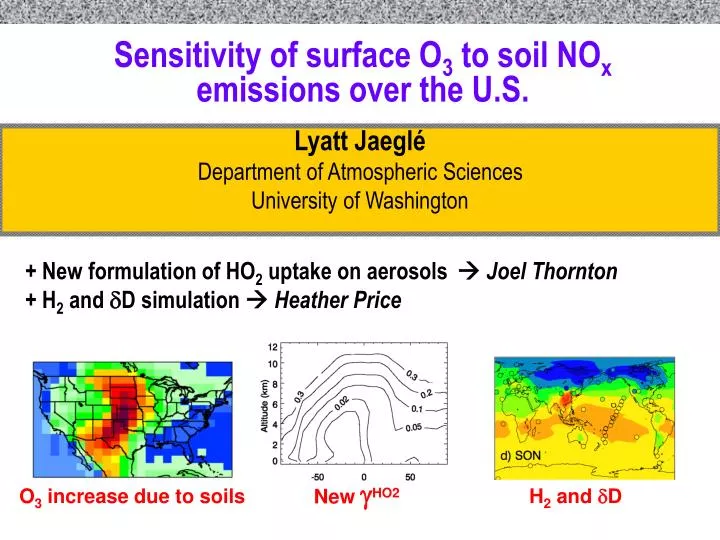
Sensitivity of surface O 3 to soil NO x emissions over the U.S. Lyatt Jaeglé Department of Atmospheric Sciences University of Washington. + New formulation of HO 2 uptake on aerosols Joel Thornton + H 2 and D simulation Heather Price. New HO2. O 3 increase due to soils.

E N D
Sensitivity of surface O3 to soil NOx emissions over the U.S. Lyatt Jaeglé Department of Atmospheric Sciences University of Washington + New formulation of HO2 uptake on aerosols Joel Thornton + H2 and D simulation Heather Price New HO2 O3 increase due to soils H2 and D
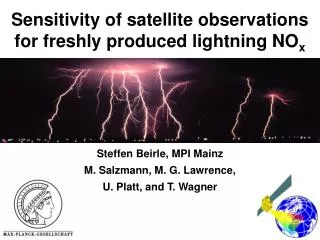
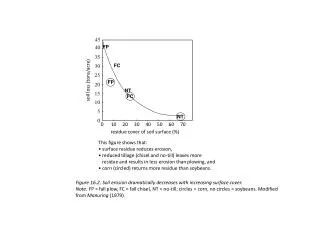
Largest soil emissions:seasonally dry tropical ecosystems +fertilized cropland ecosystems Soil NOx emissions inferred from GOME NO2 A posteriori (8.9 TgN/yr) ~70% larger than a priori A priori A posteriori (±90%) (±200%) 1010atoms N cm-2 s-1 Jaeglé et al. (2005) What are the implications for surface O3 over N. America? Sensitivity to doubling of soil NOx for dry ecosystems + fertilizer US: soil NOx increased by 85% Summer (JJA): soils = 0.6 TgN vs. anthropogenic US = 1.4 TgN
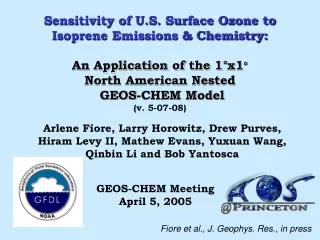
AIRS Observations: O3 1-5 pm ppbv Effects on surface O3 over the U.S. (JJA 2001) High soil: Surface O3 Standard: Surface O3 1-5 pm ppbv High soil - Standard ppbv • 3-7 ppbv increase in O3 over Great Plains+SW • Is this consistent with AIRS surface O3 observations?
Model bias +0.6 ppbv Model bias -3.5 ppbv 1-5 pm 1-5 pm • Reduced model bias over Great Plains from –3.5 to +0.6 ppbv Comparison to AIRS observations (JJA 2001) Standard – AIRS O3 High soil – AIRS O3 ppbv
AIRS observations Model with no soil emissions Standard Model Enhanced Soil Model Daily variations in surface O3 Enhanced-Standard O3 (ppbv) • Overall, soil emissions increase O3 by 7-8 ppbv + double modeled variance 1-5pm 2001
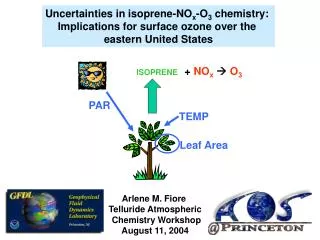
HO2 <0.005 in Tropics (temp) + industrialized/BB regions (r) Latitude Heterogeneous uptake of HO2 on aerosols If dissolved Cu(II) ions present: HO2 > 0.2 [Mozurkewich et al. 1987] Without Cu(II) ions: HO2=f(temp, aerosol radius, pH) [Thornton and Abbatt, 2005] Implement newHO2 = f(temp, r, pH=5) in GEOS-Chem for all aerosols except dust (HO2=0.2) Zonal mean HO2 Surface HO2 Low HO2 (<0.05) in LT High HO2 (>0.1) in cold UT Thornton, Jaeglé & McNeill (2007)
HO2=0.2 HO2 (%) Altitude (km) -5 to -25% H2O2 (%) Altitude (km) +5 to 30% Tie et al. [2001,2005] Martin et al. [2003] Tang et al. [2003] HO2>0.1 overestimates effects on oxidants? Effects of HO2 uptake on oxidants % change relative to HO2=0 New HO2 HO2 (%) Altitude (km) -1 to -5% aerosols HO2 0.5 H2O2 H2O2 (%) Altitude (km) +1 to 10%
What HO2 to use? INTEX-A + H2O2 • Not enough Cu(II) in aerosols for high HO2? • IMPROVE [Thornton et al., 2007], NEAQS [Murphy, 2007] • New HO2 consistent with comparisons to obs • High in UT [Jaeglé et al., 2000], low in LT over US [Hudman et al., 2007] and over BB regions [Sauvage et al., 2007] HO2 =0.2 … but inconsistent with HO2>0.1 inferred from HOx obs MBL over Mauna Loa [Cantrell et al.,1996], Cape Grim [Sommariva et al., 2004; Haggerstone et al., 2005], Mace Head [Smith et al., 2006]. Halogen chemistry? GEOS-Chem: HO2 =0.2 (v4-30, Mar ‘02-Jun ‘06) HO2 =0 (v7-04-06 and higher) Implement new formulation?
H2 profile: Poker Flat, Alaska Altitude (km) D(H2): DJF H2 (ppbv) Photochemical production (162 57‰) + stratospheric transport (34‰) H2 and D simulation in GEOS-Chem Price et al., JGR, 2007 Soil sink (55 9 Tg yr-1) H2: SON Ocean source (6 3 Tg yr-1) Observations: H2 -- CMDL ground sites + aircraft, Novelli et al. (1999) D -- cruises from Gerst & Quay (2000), Rice & Quay (2007)
Summary • Increased soil NOx emissions consistent with observed surface O3 over Great Plains • New HO2 formulation HO2 >0.1 in UT, but HO2 <0.01 in LT • Simultaneous constraints on H2 and D budget: soil sink, ocean source, and isotopic signatures.
How much copper is there in aerosols? IMPROVE Cu fine mode mass fraction 1988- 2004 1.0 0.8 0.6 Cumulative frequency distribution 0.4 0.2 Threshold for Cu-catalyzed HOx loss 0.0 1E-5 1E-4 1E-3 Cu(II) Solute Mass Fraction 90% of the observations, Cu mass fraction < 3x10⁻⁴ 50% of the observations, Cu mass fraction < 8x10⁻⁵