Hematocrit, plasma & serum
610 likes | 873 Vues
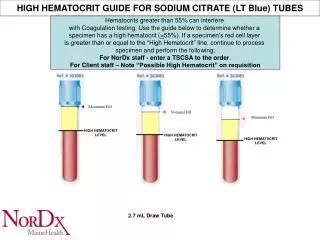
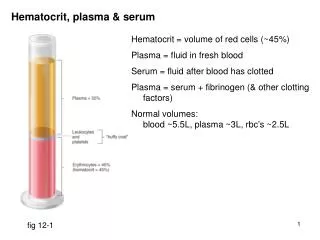
Hematocrit, plasma & serum. Hematocrit = volume of red cells (~45%) Plasma = fluid in fresh blood Serum = fluid after blood has clotted Plasma = serum + fibrinogen (& other clotting factors) Normal volumes: blood ~5.5L, plasma ~3L, rbc’s ~2.5L. fig 12-1. Systemic, pulmonary circulations.

Hematocrit, plasma & serum
E N D
Presentation Transcript
Hematocrit, plasma & serum Hematocrit = volume of red cells (~45%) Plasma = fluid in fresh blood Serum = fluid after blood has clotted Plasma = serum + fibrinogen (& other clotting factors) Normal volumes: blood ~5.5L, plasma ~3L, rbc’s ~2.5L fig 12-1
Systemic, pulmonary circulations 2 hearts, each with 2 chambers Left heart to all body except lungs (systemic) Right heart to lungs (pulmonary) Systemic arteries: oxygenated blood Pulmonary arteries: deoxygenated blood Systemic veins: deoxygenated blood Pulmonary veins: oxygenated blood Atria: receive blood from veins Ventricles: pump blood to arteries fig 12-2
Pressure, flow & resistance flow = Δ pressure / resistance It is Δ pressure that drives flow Later you will see that: blood pressure = cardiac output (flow) x peripheral resistance
Resistance resistance = 8 x x L x r4 where: = viscosity (“eta” mostly depends on hematocrit) L = length of vessel r = radius of vessel conclusion: the body regulates blood flow by altering vessel radius halving the radius 16x resistance
Heart structure fig 12-6
Heart valve structure fig 12-7 atrioventricular valves: like parachutes aortic & pulmonary valves: like pockets
Heart muscle structure fig 12-9 striated, branched cells, 1 nucleus/cell, connected by intercalated discs spontaneous contraction, regulated by autonomic NS, hormones coronary blood flow regulated by active hyperemia (see later)
Conducting system consists of modified cardiac muscle cells Sequence: sinoatrial node atrial pathways atrioventricular node Bundle of His only path to ventricles R & L bundle branches Purkinje fibers fig 12-10
Conducting system properties Spontaneous depolarization all conducting system shows spontaneous depolarization intrinsic rates: SA node (70/min), AV node (40/min), Purkinje fibers (20/min) therefore SA node sets heart rate Conduction rates slowest: AV node, ~ 100 msec delay between atrial & ventricular contraction fastest: Purkinje fibers all ventricular muscle contracts together (apex slightly ahead)
Cardiac action potential (ventricular muscle) RMP close to K+ equilibrium potential depolarization: Na+ channels open/inactivate plateau phase: Ca++ channels open, K+ channels close repolarization: Ca++ channels close, K+ channels open refractory period ~250 milliseconds value of plateau & refractory period: heart must relax before contracting again fig 12-12
Cardiac action potential (conducting tissue) RMP drifts to threshold (pacemaker potential) K+ channels closing funny Na+ channels open/close T-type Ca++ channels open depolarization: L-type Ca++ channels open repolarization: Ca++ channels close, K+ channels open plateau phase: Ca++ channels open, K+ channels close repolarization: Ca++ channels close, K+ channels open refractory period ~250 milliseconds fig 12-13
Excitation contraction coupling fig 12-18
Excitation contraction coupling L-type channel Ca++ channel acts as voltage gated channel Ca++ enters cytosol from T tubules Ca++ from T tubules stimulates opening of ryanodine receptor Ca++ channel Ca++ enters cytosol from sarcoplasmic reticulum contraction fig 12-17
Excitation contraction: cardiac vs. skeletal muscle Ca++ channels 1. L-type Ca++ channels (DHP receptor) in T tubule membrane 2. Ryanodine receptor Ca++ channels in wall of sarcoplasmic reticulum Skeletal muscle: L-type (DHP) Ca++ channel acts as voltage sensor (not as channel) L-type (DHP) mechanically opens ryanodine receptor channel Ca++ enters cytosol from sarcoplasmic reticulum contraction Cardiac muscle L-type channel Ca++ channel acts as voltage gated channel Ca++ enters cytosol from T tubules Ca++ from T tubules stimulates opening of ryanodine receptor Ca++ channel Ca++ enters cytosol from sarcoplasmic reticulum contraction Why is this important? Skeletal muscle will contract even if there is no extracellular Ca++ Ca++ channel blocking drugs (DHP derivatives): cardiac contractility, but do not skeletal muscle strength
Electrocardiogram P wave: atrial depolarization QRS complex: ventricular depolarization T wave: ventricular repolarization Atrial repolarization wave obscured by QRS complex note voltage (compare with ic electrode) fig 12-14
Cardiac cycle Systole = contraction (~ *0.3 sec) Diastole = relaxation (~ *0.5 sec) *resting rate 4 phases: 1. ventricular filling (diastole) 2. isovolumetric ventricular contraction (systole) 3. ventricular ejection (systole) 4. isovolumetric ventricular relaxation (diastole)
1. Ventricular filling AV valves A&P valves atrial P > ventricular P AV valves open aortic P > ventricular P A&P valves closed atrial contraction adds ~15% more blood
2. Isovolumetric ventricular contraction ventricular P > atrial P AV valves closed aortic P > ventricular P A&P valves closed 1st heart sound: closing of AV valves
3. Ventricular ejection AV valves A&P valves ventricular P > atrial P AV valves closed ventricular P > aortic P A&P valves open
3. Isovolumetric ventricular relaxation ventricular P > atrial P AV valves closed aortic P > ventricular P A&P valves close 2nd heart sound: closing of A&P valves
Right heart mechanics fig 12-21 Notes: Volumes, valves, sounds, & times are the same as left heart Pressures are lower because peripheral resistance of lung is lower
Cardiac output & ejection fraction Cardiac output = stroke volume x heart rate Stroke volume = end diastolic volume (EDV) – end systolic volume (ESV) Hence: cardiac output = (EDV – ESV) x heart rate at rest: EDV = ~130 ml, ESV = 60 ml, heart rate = 70/min so: resting cardiac output = (130 – 60) x 70 = 4900 ml/min = ~5L/min Ejection fraction = percentage of blood ejected with each beat = stroke volume/EDV = 70/130 = 54%
Regulation of cardiac output Heart rate: sympathetic nervous activity epinephrine parasympathetic nervous activity Stroke volume: end diastolic volume (Frank-Starling effect) sympathetic nervous activity (contractility epinephrine (contractility)
Regulation of heart rate: autonomics & epinephrine fig 12-24
Regulation of heart rate: autonomics & epinephrine fig 12-23 Curve b: sympathetic nerves end on sinoatrial node funny Na+ channels rate of depolarization (cAMP 2nd messenger) Curve c: parasympathetic nerves end on sinoatrial node AcCh open K+ channels (hyperpolarization), funny Na+ channels rate of depolarization
Regulation of cardiac output Heart rate: sympathetic nervous activity epinephrine parasympathetic nervous activity Stroke volume: end diastolic volume (Frank-Starling effect) sympathetic nervous activity (contractility epinephrine (contractility)
Regulation of stroke volume: Frank-Starling effect Mechanism: end diastolic volume stretch of ventricle better alignment of X-bridges and binding sites on actin Important for balancing output of left & right heart
Regulation of stroke volume: sympathetic NS & epinephrine Contractility contraction at a given end diastolic volume i.e. same EDV, ESV, stroke volume
Frank Starling vs. sympathetic/epinephrine These numbers are just examples Frank Starling: end diastolic volume stroke volume Sympathetic NS-epinephrine: stroke volume at given end diastolic volume
Sympathetic effects on contraction rate & force of contraction rate of relaxation
Autonomic nerves on heart Sympathetic nervous system & epinephrine (all via 1 receptors, cAMP, protein kinase A, phosphorylation) heart rate ( funny Na+ channels, Ca++ channels) contractility ( Ca++ channels) relaxation rate ( Ca++ ATPase activity, faster Ca++ release from troponin) Parasympathetic nervous system heart rate minimal effects on contractility
Arteries Functions: Structure: low resistance conduit large diameter resistance pressure reservoir elastic tissue in walls fig 12-29
Arteries as pressure reservoirs fig 12-30
Mean arterial pressure Mean arterial pressure = diastolic pressure + 1/3 pulse pressure fig 12-31a
Arterial compliance Compliance = ease of distension, i.e. larger volume change for given pressure change Mathematically: compliance = Δvolume / Δpressure fig 12-31b Aging & hypertension arterial compliance (arteriosclerosis)
Arterioles Functions: regulate blood flow to organs main component of peripheral resistance Structure: smooth muscle in walls rich autonomic supply, especially sympathetic NS fig 12-33a
Regulation of arteriolar tone 1. active & reactive hyperemia 2. flow autoregulation 3. sympathetic, parasympathetic nerves 4. hormones (epinephrine, angiotensin II, ADH/vasopressin, NO) Note: “injury” is in the objectives, but will not be on the test
Regulation of arteriolar tone: active hyperemia fig 12-34a Metabolites ( relaxation of smooth muscle blood flow to organ) decreased: O2 increased: CO2, adenosine, K+, H+ (from CO2 & lactate), osmolality Important in regulating blood flow to heart (coronaries) & skeletal muscle Reactive hyperemia block blood flow, metabolites accumulate, arterioles dilate release block, high blood flow until metabolites washed out
Regulation of arteriolar tone: flow autoregulation Mechanism 1: metabolite accumulation fig 12-34b Mechanism 2: myogenic response Especially important in brain & kidney
Regulation of arteriolar tone: autonomics Sympathetics: Generally vasoconstrictor ( receptors) Intrinsic tone (basal discharge) constriction or relaxation possible Important in constricting GI, kidney, skin arterioles Parasympathetics: Not important Nonadrenergic, noncholinergic (NANC) neurons: NO is neurotransmitter; important in genitals, GI tract
Regulation of arteriolar tone: hormones Epinephrine: Generally vasoconstrictor ( receptors) Vasodilator in skeletal muscle ( receptors) Angiotensin II Powerful vasoconstrictor Additional action to aldosterone release ADH (aka vasopressin) Powerful vasoconstrictor Additional role to cause water retention by kidneys (antidiuresis) Nitric oxide NO Acts as neurotransmitter & paracrine: vasodilator
Capillaries: anatomy fig 12-37 permeability: permeable to all molecules except proteins, transport by diffusion via intercellular clefts & transcellular vesicles & fused vesicle channels: uncertain function
Microcirculation structure fig 12-38 precapillary sphincters: regulated by metabolite levels metarterioles: potential short circuits between arterioles & venules
Capillary flow velocity fig 12-39 Distinguish between: flow volume of blood (ml/min) & flow velocity of single red cell (cm/min) flow velocity in capillaries is slowest because total XS area is greatest Consequence: blood lingers in capillaries for nutrient & waste exchange
Fluid exchange across capillary wall Permeability of capillary endothelium: freely permeable to molecules < ~ 5000 MWt (gases, ions, glucose, amino acids, hormones) relatively impermeable to protein Therefore, interstitial fluid = plasma without the protein & red cells Transport of solutes: mostly by simple diffusion via intercellular clefts & some transcellular some “bulk flow” ( fluid flow carries solutes across endothelium) Edema: excessive accumulation of fluid in interstitial fluid space
Fluid exchange across capillary wall (Starling forces) fig 12-42a Balance of fluid between plasma & interstitium controlled by 4 forces Outward forces: plasma interstitial fluid (“filtration”), given +ve sign capillary hydrostatic pressure (PC) interstitial fluid protein osmotic pressure (IF) Inward forces: interstitial fluid plasma (“reabsorption”), given –ve sign plasma protein protein osmotic pressure (P) interstitial fluid hydrostatic pressure (PIF)
Starling forces: the numbers fig 12-42b The most important forces are capillary hydrostatic pressure (PC) & plasma protein protein osmotic pressure (P) 3-4 L/day more fluid is filtered than is absorbed That 3-4 L re-enters blood via the lymph (lymph composition = interstitial fluid composition) Edema develops if net filtration > lymph flow
Veins Function: capacitance vessels contain ~60% of blood regulate venous flow to heart Structure: thin walls, smooth muscle valves large diameter, low resistance fig 12-44
Regulation of venous return (VR) to heart 1. sympathetic activity SNS vein compression VR 2. muscle pump muscle activity vein compression VR 3. ventilation inspiration atrial pressure VR 4. blood volume blood volume (kidney) VR fig 12-45