Download

1 / 45
460 likes | 684 Vues
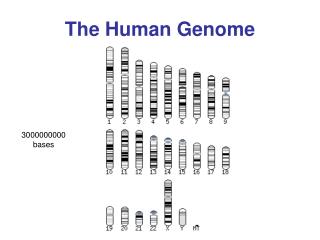
Causes of regulatory variation in the human genome. Manolis Dermitzakis The Wellcome Trust Sanger Institute Wellcome Trust Genome Campus Cambridge, UK md4@sanger.ac.uk. Human Genome: ~25,000 genes 1-1.5% of the human DNA is coding Is the remaining 98.5% “junk”.

E N D
Causes of regulatory variation in the human genome Manolis Dermitzakis The Wellcome Trust Sanger Institute Wellcome Trust Genome Campus Cambridge, UK md4@sanger.ac.uk
Human Genome: ~25,000 genes 1-1.5% of the human DNA is coding Is the remaining 98.5% “junk”
Gene expression as a phenotype • Altered patterns of gene expression disease. • e.g., Type 1 diabetes, Burkitt’s lymphomas. • Widespread intraspecific variation. • Heritable genetic variation for transcript levels. • Familial aggregation of expression profiles (Cheung et al. 2003). • In humans, ~30% of surveyed loci exhibited a genetic component for expression differences (Monks et al. 2004; Schadt et al. 2003). • Much of the influential variation is located cis- to the coding locus. • In humans, mouse, and maize, 35%-50% of the genetic basis for intraspecific differences in transcription level are cis- to the coding locus (e.g. Morley et al. 2004; Schadt et al. 2003; Stranger et al. 2005; Cheung et al. 2005, etc.). Stranger and Dermitzakis 2006
Why study gene expression • Describe and dissect regulatory variation • Annotate regulatory elements in the human genome • Support disease studies to interpret statistical signals • Distribution of molecular effects in the genome • Natural selection
Outline • Gene expression variation – recent studies • Analysis of gene expression with HapMap phase II SNPs • Update on CNV-expression associations • Natural selection and cis regulatory effects
GENE REG DNA i) Pre-mRNA ii) mRNA iii) Protein GENE REG iv) DNA Nature of regulatory variation Expression Stranger and Dermitzakis, Human Genomics 2005
Effects of Copy Number Variation on gene expression
Gene expression association mapping AA AG GG Stranger et al. PLoS Genet 2005
Cell line RNA IVT1 IVT2 rep2 rep3 rep1 rep4 Whole-genome gene expression • ~48,000 transcripts • 24,000 RefSeq • 24,000 other transcripts • 270 HapMap individuals: • CEU: 30 trios, 90 total • CHB: 45 unrelated • JPT: 45 unrelated • YRI: 30 trios, 90 total • 2 IVTs each person • 2 replicate hybridizations each IVT • Quantile normalization of all replicates of each individual. • Median normalization across all individuals of a population. illumina Human 6 x 2 gene GEX arrays
14,072 genes Phase I HapMap; MAF > 0.05 CEU: 762,447 SNPs CHB: 695,601 JPT: 689,295 YRI: 799,242 ~1/5kb HapMap SNPs 60 CEU 45 CHB 44 JPT 60 YRI
Copy Number Variation dataset • Genome Structural Variation Consortium • Redon et al. Nature Nov 22, 2006 • Array-CGH using a whole genome tile path array • Median clone size ~170 kb • All 270 HapMap individuals • Quantitative values (log2 ratios) representing diploid genome copy number, not genotypes. • 1117 CNVs called from log2 ratios • Calls based on standard deviation of log2 ratios • Many CNVs experimentally verified 26,563 clones 93.7% euchromatic genome
Linear regression for SNPs CNV and expression Clone signal (log2 ratio)
SNP cis-analysis: SNPs within 1Mb of probe midpoint 1Mb 1Mb 2Mb window probe gene SNPs
CNV cis-analysis: clone midpoint within 2Mb of probe midpoint 2Mb 2Mb 4Mb window probe gene clones
Permutation GENOTYPES GENE EXPRESSION g11 g12 g13 g14 … g1n g21 g22 g23 g24 … g2n g31 g32 g33 g34 … g3n … … … gi1 gi2 gi3 gi4 … gin Exp1 Exp2 Exp3 … … … Expi permute - 10,000 permutations – each time keep lowest p-value - Null distribution of 10,000 extreme p-values - Compare observed p-values to the tails of the null Doerge and Churchill 1996
CNV vs. SNP associations Stranger et al. Science 2007
CNVs and SNPs mostly capture different effects • Relative impact on gene expression: 82% SNPs 18% CNVs • Only 13% of genes with CNV association also had a SNP association in the same population • biased toward large effect size. • CNV and SNP variation are highly correlated (p-value 0.001).
Custom vs. Genome-wide[Stranger et al. 2005 PLoS Genet and Stranger et al. 2007 Science] • 2 batches of 60 CEU individuals • grown independently at two different labs • RNA extraction and labelling by different labs and people • Run in custom and gw illumina arrays • 97% of associations at the 0.05 permutation threshold from the custom array analysis were also detected in gw analysis
HapMap phase II analysis • ~ 4 million SNP genotypes made publicly available for the 270 HapMap individuals. • Density: 1 SNP/ 700 bps • Includes ~50% of expected common SNPs in these populations. • 2.2 million SNPs analyzed (MAF>0.05)
Phase I vs. Phase II cis- significant genes (0.001) 86% 90% 85% 85% 87% 87% 79% 87%
Distribution of regulatory elements around the TSS ENCODE Nature 2007
Direction of allelic effectsame SNP-gene combination across populations Population 1 Population 2 AGREEMENT log2 expression log2 expression OPPOSITE log2 expression log2 expression
Pooling populations Spurious associations Pop2 Pop1 Pop1 Pop2
Conditional permutations Permute data within each pop separately then perform test X 4
Figure 2A Proportion of single pop cis associated genes detected in multi-population analysis Number of populations sharing association in cis: single population analysis
miRNA SNPs spliceSNPs rSNPs nsSNPs GENE REG DNA Genome-wide associations Trans- phase II HapMap association • Biological hypotheses: functional categories • Regulatory SNPs identified from cis- analysis (52%) • Non-synonymous SNPs (39%) • Splice site SNPs (7%) • miRNA SNPs (1%) GENE • ~ 25,000 SNPs per population x 14,072 genes
Trans- associations 10-3 threshold correction at 0.001 15 genes estimated false positives FDR = 33%-39% correction at 0.01 150 genes estimated false positives FDR = 60%-75% 14,072 genes tested
Enrichment of regulatory SNPs and deficit of nsSNPs in trans- associations ! 3-6x more likely that a cis regulatory effect explains a trans regulatory effect
Multi-pop CNV analysis • Combined 4 populations: 193 genes at 0.001 (48 overlap with the 99 from single population analysis) • Combined 3 populations: 173 genes at 0.001 (42 overlap with the 99 from single population analysis)
CNV trans effects Variable expression Biological pathway
Gene expression and natural selection -logpval TSS TSS With Sridhar Kudaravalli and Jonathan Pritchard (unpublished)
Gene expression and natural selection With Sridhar Kudaravalli and Jonathan Pritchard (unpublished)
Co-segregating regulatory variants can drive differential isoform expression
SUMMARY • Cis- and trans- acting genetic variation influencing mRNA levels. • CNV effects detected are largely not captured by SNPs • Structural variation (copy number polymorphism) influences transcript level variation. • Many detected associations are shared across human populations – replication of effects • Signal concentrated within 100 Kb from the promoter symmetrically • Trans-acting effects of CNVs - interpretation • Primary effects of trans associations are largely cis regulatory effects • Cis regulatory effects under positive selection
Acknowledgements Cambridge University Mark Dunning Natalie Thorne Simon Tavaré Barbara Stranger Alexandra Nica Antigone Dimas Christine Bird Matthew Forrest Catherine Ingle Claude Beazley Panos Deloukas Matt Hurles Stanford Daphne Koller illumina Jill Orwick Mark Gibbs Genome Structural Variation Consortium Richard Redon, Nigel Carter, Charles Lee, Chris Tyler-Smith, Stephen Scherer, The HapMap Consortium Wellcome Trust for funding