Understanding the General Linear Model and Regression Analysis in Experimental Research
This guide explores the General Linear Model (GLM) and regression analysis, essential tools for analyzing relationships between variables in experimental research. It defines the roles of dependent and independent variables, illustrating how independent variables shape experiments while dependent variables measure results. The GLM showcases how various factors contribute to the response of a system, allowing for robust analysis of data relationships. By examining regression coefficients, researchers can quantify the influence of predictors on outcomes, ensuring reliable results even amidst complex variability.

Understanding the General Linear Model and Regression Analysis in Experimental Research
E N D
Presentation Transcript
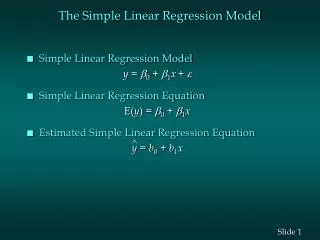
The general linear model: • Y = μ + σ2(Age) + σ2(Sex) + σ2(Genotype) + σ2(Measurement) + σ2(Condition) + ε • Y: response of the system • μ: grand mean • σ2: variance from the factor • ε: error
Dependent vs. independent variables • Independent varables ARE MANIPULATED in the experiment • Dependent ones ARE NOT MANIPULATED • Independent variables shape the experiment • Dependent variables measure its result
Description of the established relations: • Strong? • Absolutely • Related to other relations • Confident? • By different tests • Robust? What happens if: • we change the method? • the distribution changes the shape?
The purpose of the general linear model The theory seeks to identify those quantities in systems of equations which remain unchanged under linear transformations of the variables in the system. I.e.: an eternal and unchanging amongst the chaos of the transitory and the illusory.
The purpose of the regression analysis, more specifically: Quantify the relationship between several independent or predictor variables and a dependent or criterion variable.
Multiple regression The regression coefficients represent the independent contributions of each independent variable to the prediction of the dependent variable. In other words, variable X1 is correlated with the Y variable, after controlling for all other independent variables (=partial correlations).
The general linear model can be expressed as YM = Xb + e Here Y, X, b, and eare as described for the multivariate regression model and M is an m x s matrix of coefficients defining s linear transformation of the dependent variable. The normal equations are X'Xb =X' YM and a solution for the normal equations is given by b = (X'X)`X' YM Here the inverse of X'X is a generalized inverse if X'X contains redundant columns.
Matrix ill conditioning • numerical round-off in designs with very different variances of values in different columns of the design matrix Rescale it!
In the general linear model x = μ + σ2(Age) + σ2(Sex) + σ2(Genotype) + σ2(Measurement) + σ2(Condition) + ε Each of the terms σ2 can be questioned. Moreover, their particular combinations can be studied. x = μ + … σ2(Age X Sex) + … + σ2(Sex X Genotype) + σ2(Age X Genotype X Condition) + … + ε Examples: “Does the disease prognosis deteriorate with age equally for men and women?” H0: σ2(Age X Sex) = 0 “Is not genotype AbC reaction particularly difficult to detect by measuring with tool Z?” H0: σ2(Genotype X Measurement) = 0
Statistical significance p-level: the probability of the relation to NOT EXIST