Download
1 / 5

E N D
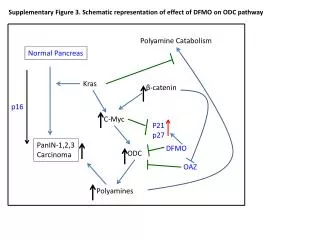
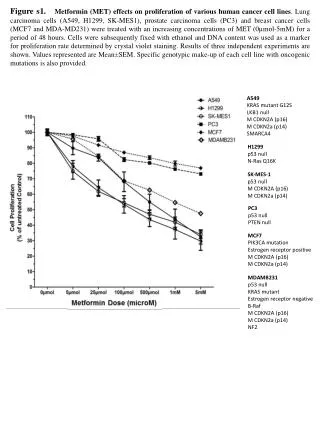
Figure s1. Metformin (MET) effects on proliferation of various human cancer cell lines. Lung carcinoma cells (A549, H1299, SK-MES1), prostate carcinoma cells (PC3) and breast cancer cells (MCF7 and MDA-MD231) were treated with an increasing concentrations of MET (0µmol-5mM) for a period of 48 hours. Cells were subsequently fixed with ethanol and DNA content was used as a marker for proliferation rate determined by crystal violet staining. Results of three independent experiments are shown. Values represented are Mean±SEM. Specific genotypic make-up of each cell line with oncogenic mutations is also provided. A549 KRAS mutant G12S LKB1 null M CDKN2A (p16) M CDKN2a (p14) SMARCA4 H1299 p53 null N-Ras Q16K SK-MES-1 p53 null M CDKN2A (p16) M CDKN2a (p14) PC3 p53 null PTEN null MCF7 PIK3CA mutation Estrogen receptor positive M CDKN2A (p16) M CDKN2a (p14) MDAMB231 p53 null KRAS mutant Estrogen receptor negative B-Raf M CDKN2A (p16) M CDKN2a (p14) NF2
Figure s2. Metformin (MET) effects on proliferation of human lung embryonic fibroblast cell line. Human lung embryonic fibroblast cell line was treated with an increasing concentrations of MET (0µmol-25µmol) for a period of 48 hours. Cells were subsequently fixed with ethanol and DNA content was used as a marker for proliferation rate determined by crystal violet staining. Results of three independent experiments are shown. Values represented are Mean±SEM.
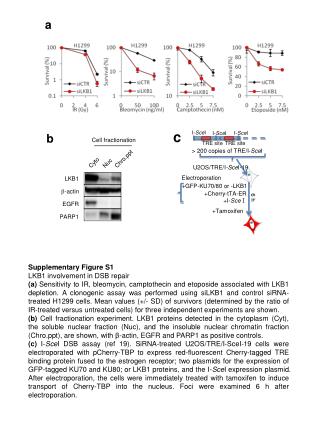
Figure s3. Rapamycin and Ionizing Radiation (IR) inhibit proliferation of A549 human lung cancer cells. A549 human lung cancer cells were treated with increasing doses of rapamycin (5-500nM) for 24 hours before treatment with 0, 2 or 8 Gy IR. Cells were fixed 48h later with methanol. DNA content, as a marker of proliferation, was determined with crystal violet staining. Results of three independent experiments are shown as Mean ± SEM. Statistically significant differences compared to corresponding control cells (not treated with rapamycin) within the 0Gy 2Gy and 8Gy IR treatment groups are shown (×:P<0.05, ××:P<0.01 for 0Gy group, #:P<0.05, ##:P<0.01 for 2 Gy group, and *: P< 0.05, **: P<0.01 for 8Gy group, respectively).
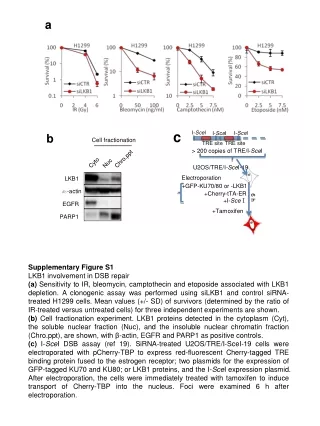
Figure s4. Effects of Rapamycin and/or IR treatment on expression and phosphorylation of members of the Akt – mTOR pathway. A549 cells were treated with Rapamycin (0nM or 5nM) for 24 or 48 hours, IR (0, 2 or 8Gy) for 1 or 24 hours or combined Rapamycin + IR treatments as indicated. The cells were washed and lysed. Lysates were analyzed with immunoblotting using indicated antibodies. Representative images of 3 independent immunoblotting experiments are shown for total and phosphorylated Akt (S473 and T308), mTOR and phosphorylated 4EBP1.
Figure s5. Comparison of the anti-proliferative effects of MET with Rapamycin or Gefitinib in untreated and irradiated A549 lung cancer cells. A549 human lung cancer cells were treated with increasing MET (5µM-5mM), rapamycin (5nM-500nM), or Gefitinib (1µM-4µM) doses for 24 hours before treatment with 0, 2 or 8 Gy IR. Cells were fixed 48h later with methanol. DNA content, as a marker of proliferation, was determined with crystal violet staining. Results of three independent experiments are shown as Mean ± SEM. Statistically significant differences compared to corresponding control cells (not treated with either agent) within the 0Gy 2Gy and 8Gy IR treatment groups are shown (*:P<0.05, **:P<0.01 for MET treated cells, #:P<0.05, ##:P<0.01 for rapamycin treatment, and ×:P< 0.05,××: P<0.01 for Gefitinib treatment respectively). Horizontal lines facilitate a visual comparison of the effects of 5mM MET + 2Gy IR and 5mM MET + 8 Gy IR with the rest of the treatment conditions.