Download
1 / 18
180 likes | 356 Vues
The Greening Of Land Surface Models (or, what we have learned about climate-vegetation interactions during ten years of CCSM). Gordon Bonan Terrestrial Sciences Section/CGD. light. CO 2 + 2 H 2 O CH 2 O + O 2 + H 2 O. History of land surface models. Precipitation. Evaporation.

E N D
The Greening Of Land Surface Models (or, what we have learned about climate-vegetation interactions during ten years of CCSM) Gordon Bonan Terrestrial Sciences Section/CGD
light CO2 + 2 H2O CH2O + O2 + H2O History of land surface models Precipitation Evaporation • E = Ep • = 1 for w w0 • = w/w0 for w w0 Vegetation and Hydrologic Cycle Critical depth, w0 Runoff Water depth, w • Dickinson et al. (1986) NCAR/TN-275+STR • Sellers et al. (1986) J. Atmos. Sci. 43:505-531 Bucket Model Manabe (1969) Mon Wea Rev 97:739-774 Williamson et al. (1987) NCAR/TN-285+STR Stomatal Gas Exchange CO2 H2O Leaf cuticle Guard cell Guard cell Dynamic Vegetation Photosynthetically active radiation Chloroplast Foley et al. (1996) GBC 10:603-628 Levis et al. (1999) JGR 104D:31191-31198 Levis et al. (2000) J Climate 13:1313-1325 Cox et al. (2000) Nature 408:184-187 Bonan (1995) JGR 100:2817-2831 Denning et al. (1995) Nature 376:240-242 Denning et al. (1996) Tellus48B:521-542, 543-567
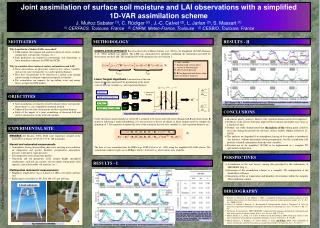
Scales and types of vegetation interactions Ecological processes affect climate at a variety of scales: Stomata – Pores on leaf surfaces that open to allow CO2 uptake during photosynthesis. In doing so, water is lost from the plant during transpiration Phenology – The seasonal emergence and senescence of foliage Succession – Growth and development of vegetation, typically following fire, timber harvesting, or farm abandonment Land use – Clearing of natural vegetation (typically forest or grassland) for agricultural uses Biogeography – Changes in geographic distribution of vegetation in response to climate change Minutes-to-hours Seasonal-to-interannual Decades-to-centuries Centuries-to-millennia These affect climate through biogeochemical processes (e.g., CO2) and through biogeophysical processes that affect radiative forcing, turbulent fluxes, and the hydrologic cycle The carbon cycle, for example, has direct effects on climate (atmospheric CO2) and indirect effects (e.g., by changing leaf area)
Land cover change as a climate forcing Future IPCC SRES Land Cover Scenarios for NCAR LSM/PCM Forcing arises from changes in Community composition Leaf area Height [surface roughness] Surface albedo Turbulent fluxes Hydrologic cycle Also alters carbon pools and fluxes, but most studies of land cover change have considered only biogeophysical processes Feddema et al., unpublished
Land use climate forcing SRES B1 SRES A2 2050 Dominant forcing Brazil – albedo, E U.S. – albedo Asia - albedo 2100 PCM/NCAR LSM transient climate simulations with changing land cover. Figures show the effect of land cover on temperature (SRES land cover + SRES atmospheric forcing) - SRES atmospheric forcing Feddema et al., unpublished
Sapwood 0 500 1000 0.01 PPFD (molm-2s-1) 0 15 30 Temperature (C) g CO2g-1s-1 0 -10 25 60 Temperature (C) 0 -1 -2 Foliage Water Potential (MPa) 0 1500 3000 Vapor Pressure Deficit (Pa) 0 500 1000 Ambient CO2 (ppm) 6 6 6 4 4 4 1 2 2 2 0 0 0 Relative Rate 0 0 100 Soil Water (% saturation) 0 1 2 Foliage Nitrogen (%) Ecosystem Carbon Balance Foliage Root Photosynthesis 0.5 0.3 g CO2g-1s-1 g CO2g-1s-1 Growth Respiration 0 0 -10 25 60 -10 25 60 g CO2g-1s-1 Temperature (C) Temperature (C) Autotrophic Respiration g CO2g-1s-1 Litterfall Heterotrophic Respiration 8 g CO2g-1s-1 Relative Rate 1 15 0 30 Nutrient Uptake Temperature (C) Vegetation dynamics Two classes of models Biogeochemical model Dynamic global vegetation model Simulates carbon cycle. Carbon pools vary over time so that, e.g., leaf area and height [roughness] change with time. May include other BGCs (e.g., nitrogen) and fire. Uses prescribed biogeography (i.e, type of vegetation is time invariant) CLM3-CASA’ and CLM3-CN to study biogeochemical coupling with atmosphere As in BGC model, but allows plant community composition to change over time (e.g., forest changes to grassland) CLM3-DGVM used to study biogeophysical coupling with atmosphere.
Greening of North Africa 6kaBP DynVeg Soil Texture – 0 kaBP Present Day Biogeography (percent of grid cell) Precipitation Change From Present Day Albedo Vegetation and soil Dominant forcing Increase in evaporation Decrease in soil albedo Orbital geometry Levis et al. (2004) Clim Dyn 23:791-802
Mean Annual Temperature (2CO2) One Grid Cell In Canada Additional Temperature Change With Vegetation Bonan et al. (2003) Global Change Biology 9:1543-1566 Bonan & Levis, unpublished Boreal forest expansion Dominant forcing Decrease in albedo [Carbon storage could mitigate warming]
Precipitation biases CAM3/CLM3 (1984-2000) Annual Precipitation Precipitation Bias Too little precipitation in eastern U.S. and Amazonia
Needleleaf Evergreen Trees (%) Broadleaf Deciduous Trees (%) Other Deciduous Trees (%) Grasses (%) Hydrology biases and vegetation CAM3 and CLM3 have dry biases that adversely affect the simulation The coupled CAM3/CLM3-DGVM cannot simulate a forest in eastern U.S. Uncoupled CLM3-DGVM simulations demonstrate the sensitivity of vegetation to precipitation Bonan & Levis (2005) J. Climate, CCSM special issue
Similar problems occur in Amazonia The coupled CAM3/CLM3-DGVM cannot simulate a tropical evergreen forest. Hydrology changes that improve CLM3-DGVM uncoupled to CAM3 initiate a catastrophic decrease in precipitation and forest dieback when coupled to CAM3 Bonan & Levis (2005) J. Climate, CCSM special issue
BGC model shows similar sensitivity Model A: CAM3/CLM3-CN (Thornton hydrology) cooler Amazon Model B: CAM3/CLM3-CN (Lawrence hydrology) warmer Amazon Temperature difference (A-B) Global total carbon (A) (B) Thornton, unpublished
C4MIP – Climate and carbon cycle • Nine climate models of varying complexity with active carbon cycle • Transient climate simulations through 2100 • Vegetation forcings of climate • Direct biogeochemical effect (atmos. CO2) • Indirect biogeophysical effect (stomata, leaf area, biogeography) • Transient land cover change • Models have large uncertainty in simulated atmospheric CO2 at 2100 • > 1000 ppm • < 750 ppm CSM1 Courtesy of Pierre Friedlingstein
C4MIP – Climate and carbon cycle CSM1 • Conclusion • Terrestrial carbon cycle can be a large climate feedback • Considerable more work is needed to understand this feedback • How will carbon cycle science be advanced? Is there a tradeoff between more complexity (e.g., N, wildfire) and understanding? • Uncertainty arises from differences in terrestrial fluxes • One model simulates a large source of carbon from the land • Another simulates a large terrestrial carbon sink • Most models simulate modest terrestrial carbon uptake Figures courtesy of Pierre Friedlingstein
Carbon-nitrogen interactions Gross Primary Production Nitrogen Deposition • CLM-CN simulation forced with: • Atmospheric data for 1870 (CAM3) • Transient N-deposition • Result • N-deposition increases carbon uptake on land Net Carbon Flux Total Land Carbon Source Sink Thornton, Lamarque, et al., unpublished
Climate of the 20th and 21st centuries Global mean T 1870-2100 Climate Forcings Greenhouse gases Ozone Solar variability Sulfate aerosols Volcanic aerosols Black carbon aerosols Meehl et al. (2005) J. Climate, CCSM special issue What is the vegetation forcing of climate? How do we distinguish the biogeochemical processes (e.g., CO2) from the biogeophysical processes that affect radiative forcing, turbulent fluxes, and the hydrologic cycle? How do we distinguish the direct effects of the carbon cycle (atmospheric CO2) from indirect effects (community composition, leaf area, phenology, stomatal conductance)? How do we gain confidence in our simulation of the vegetation forcing?
Quantify and understand vegetation forcing of climate Vegetation affects climate through human perturbations to the land surface and through feedbacks • Human forcings • Land use • Cropland • Pastureland • Irrigation • Urbanization • N deposition • Vegetation feedbacks • Stomata – CO2 fertilization • Phenology – Changing growing season length • Vegetation dynamics • Leaf area • Plant community composition • Biogeography • Wildfire Its not just biogeochemistry … These affect climate through biogeochemical processes (e.g., CO2, dust) and through biogeophysical processes that affect radiative forcing, turbulent fluxes, and the hydrologic cycle
Lessons learned from 10 years of CCSM? • The past ten years of CCSM development and application have greatly advanced our ability to model vegetation feedbacks on climate and our understanding of the importance of vegetation for climate simulation. Why? • Compelling science cannot be denied - The CCSM plan called out the importance of vegetation, especially biogeochemistry, from the start • Do not over plan - Just do it! • The next ten years of CCSM need to see focused studies of land-atmosphere coupling • More study of precipitation over land • More thorough analysis of the terrestrial hydrologic cycle. Carbon cycle and dynamic vegetation are essentials diagnostics • Need to unify BGC (2) and DGVM (2) models • No guarantee that coupled model will perform well. How do we ‘live’ with model biases? • Numerous well-posed climate sensitivity experiments to unravel vegetation forcing