Heart activity
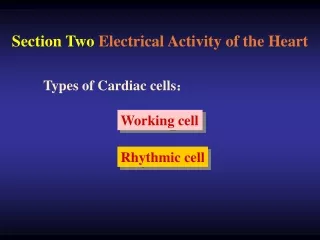
Heart activity. Modulation of autorhythmic cells Electrical activity co-ordinates heart contraction Pacemakers Electrocardiogram shows heart electrical activity. close. Modulation of autorhythmic cells. NE (sympathetic) and E (adrenal hormone) Autorhythmic cells have beta1 receptors

Heart activity
E N D
Presentation Transcript
Heart activity • Modulation of autorhythmic cells • Electrical activity co-ordinates heart contraction • Pacemakers • Electrocardiogram shows heart electrical activity
Modulation of autorhythmic cells • NE (sympathetic) and E (adrenal hormone) • Autorhythmic cells have beta1 receptors • Cyclic AMP levels increase • Properties of If and Ca++ channels altered • More rapid Na+ and Ca++ entry • Rapid action potential • Rapid contractions
Modulation of autorhythmic cells • Parasympathetic, acetyl choline • Muscarinic receptors • K+ channels open mb hyperpolarizes cell less excitable • Ca++ channel less likely to open slower depolarization cell is less excitable
Electrical activity in the heartHeart muscular activity • autorhythmic cells. • Conductive system of the heart • The ECG • Muscular activity • The five phases of the heart cycle.
The heart’s main pacemaker is in the sinoatrial node (SA node) where a group of autorhythmic cells are located at the junction of the vena cava and the right atrium
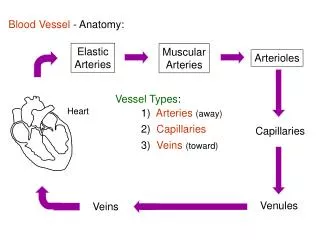
The conductive system of the heart consists of noncontractile autorhythmic cells
Action potentials encounter fibrous Tissue at the junction of the atria and Ventricles.
Action potential reach the ventricles Through the AV node, then spread Rapidly down the bundle of His.
Prukinje fibers rapidly transmit • Impulses up the ventricle • All contractile cells at apex Contract simultaneously
Why does the AV node delay action potentials? • This allows the atria to complete contraction and allows the ventricles to fill before the ventricles contract
Autorhythmic cells • All cells of the conducting fibers are autorhythmic • The cells of the SA node set the heart rate because their rhythm is fastest. • They set the pace. • If the SA node is damaged, the other pacemakers still function, the pace lowers.
The electrocardiogram shows the electrical activity of the heart. • ECG • Electrodes placed on the skin • On arms and leg • ECG shows summated electrical activity during heart activity • Indirectly shows contraction and relaxation of atria and ventricles
Einthoven’s triangle. Location of electrode placement For ECG
ECG • P wave, atria depolarize • QRS complex, wave of ventricular depolarization • T wave, ventricles repolarize
The heart cycle • Period from the beginning of one heart beat to the beginning of the next heart beat • Two phases: • Diastole, period of cardiac muscle relaxation • Systole, period of cardiac muscle contraction • The atria and ventricles do not contract and relax at the same time.
5 phases of the heart cycle • Heart at rest (atrial and ventricular diastole) • Completion of ventricular filling (atrial systole) • Early ventricular contraction (first heart sound) • The heart pumps (ventricular ejection) • Ventricular relaxation (second heart sound)
Heart activity • Pressure/volume curves represent one cardiac cycle • Stroke volume is the volume of blood pumped by one ventricle in one contraction • Cardiac output is a measure of cardiac performance • Heart rate is varied by autonomic neurons and catecholamines • Multiple factors influence stroke volume
The heart cycle • Period from the beginning of one heart beat to the beginning of the next heart beat • Two phases: • Diastole, period of cardiac muscle relaxation • Systole, period of cardiac muscle contraction • The atria and ventricles do not contract and relax at the same time.
5 phases of the heart cycle • Heart at rest (atrial and ventricular diastole) • Completion of ventricular filling (atrial systole) • Early ventricular contraction (first heart sound) • The heart pumps (ventricular ejection) • Ventricular relaxation (second heart sound)
Heart at rest (atrial and ventricular diastole) • Atria and ventricles are relaxing • blood flows into the atria from veins • AV valves are open • Blood flows into the ventricles from the atria • Relaxed ventricles accept blood
2. Completion of ventricular filling (atrial systole) • Depolarization from the SA node • Contraction of atria • Blood pushed into the ventricles • Pressure increase accompanies contraction • Increase in pressure pushes some blood back to the veins
3. Early ventricular contraction (first heart sound) • Depolarization to AV node, down bundle of His, up Purkinje fibers • Ventricular systole begins at apex • Blood pushing up on AV pushes them shut • Blood does not flow back to atria • First heart sound when AV valves close (lub)
3. Early ventricular contraction (first heart sound) • The semilunar valves are also shut • Blood stays in the ventricle while it contracts • High pressure on the heart walls during this contraction • ISOMETRIC CONTRATION
3. Early ventricular contraction (first heart sound) • Atria begin to repolarize and relax Atrial pressure falls below venous pressure • Blood flows from veins to atria Blood stays in atria because the AV valves are closed
4. The heart pumps (ventricular ejection) • Ventricles contract • Semilunar valves open • Ventricular blood is pushed into the arteries
5. Ventricular relaxation (second heart sound) • Ventricular pressure falls • Blood starts to flow from arteries into ventricles • This backflow shuts the semilunar valves (dup of lub-dup) • Ventricles become closed • AV valves open when ventricular pressure is lower than atrial pressure
Heart activity • Pressure/volume curves represent one cardiac cycle • Stroke volume is the volume of blood pumped by one ventricle in one contraction • Cardiac output is a measure of cardiac performance • Heart rate is varied by autonomic neurons and catecholamines • Multiple factors influence stroke volume
End Diastole Volume (EDV) • Ventricles are maximally filled at the end of ventricular relaxation (diastole) • When heart rate is very high, the ventricles may not have enough time to fill as much as when the heart rate is slow
End-systole volume (ESV) • The amount of blood left in the heart at the end of each contraction
Pressure-volume curves Match the cardiac cycle. Left ventricular pressure-volume changes during one cardiac cycle.
Wiggers Diagram
Wed. Nov. 30 • Stroke volume • Cardiac output • Heart rate is varied by autonomic neurons and catecholamines • Factors influencing stroke volume • Length-tension relationships and Starling’s Law of the heart • Stroke Volume and venous return • Control of contractility
Stroke volume • Volume of blood pumped out by one ventricle in one contraction • Volume of blood before contraction minus volume of blood after contraction is the stroke volume.
Stroke Volume • EDV - ESV = Stroke Volume • 135 - 65 = 70 ml for normal stroke volume.
Cardiac Output • A measure of cardiac performance • The volume of blood pumped out of the ventricle per unit time indicates the blood (oxygen) is available to flow into tissues.
Cardiac Output • Cardiac Output = Heart rate X stroke vol. • CO = 72 beats/min x 70 ml/beat • CO = 5040 mL/min (5 L/min) • This is at rest.
Cardiac Output • At rest around 5 L/minute • During exercise up to 35 L/minute • How does CO increase? (CO = SV x HR)
Effect of autonomic neurons and catecholamines. • Effect on autorhythmic cells in the SA node. • Sympathetic and parasympathetic division of the autonomic nervous system have antagonistic effects.
Parasympathetic effect slows heart rate. • Sympathetic effect speeds up heart rate. • Tonic control of heart is dominated by the parasympathetic branch.