Exploring Gene Expression Changes in Imiquimod-Treated EOT Samples Through Hierarchical Clustering
10 likes | 128 Vues
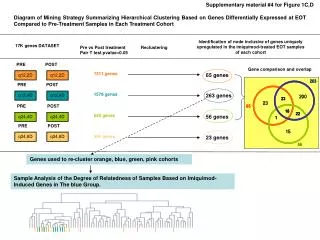
This supplementary material presents an analysis of gene expression variations observed between pre-treatment and post-treatment samples in different cohorts. Utilizing hierarchical clustering, we identify genes significantly upregulated in imiquimod-treated samples. The study includes data from 17,000 genes, highlighting the differences observed via pairwise t-tests with p-values less than 0.05. Key findings include the clustering of distinct gene groups that reflect treatment responses, showcased through various visual representations and sample relatedness analyses.

Exploring Gene Expression Changes in Imiquimod-Treated EOT Samples Through Hierarchical Clustering
E N D
Presentation Transcript
Supplementary material #4 for Figure 1C,D PRE POST q12,2D q12,2D PRE POST q12,4D q12,4D PRE POST q24,4D q24,4D PRE POST q24,8D q24,8D Diagram of Mining Strategy Summarizing Hierarchical Clustering Based on Genes Differentially Expressed at EOT Compared to Pre-Treatment Samples in Each Treatment Cohort Identification of node inclusive of genes uniquely upregulated in the imiquimod-treated EOT samples of each cohort 17K genes DATASET Pre vs Post treatment Pair T test pvalue<0.05 Reclustering Gene comparison and overlap 1311 genes 65 genes 1578 genes 263 genes 650 genes 56 genes 495 genes 23 genes Genes used to re-cluster orange, blue, green, pink cohorts Sample Analysis of the Degree of Relatedness of Samples Based on Imiquimod-Induced Genes in The blue Group.