
Motion
E N D
Presentation Transcript
Motion S8P3. Students will investigate relationship between force, mass, and the motion of objects. a. Determine the relationship between velocity and acceleration.
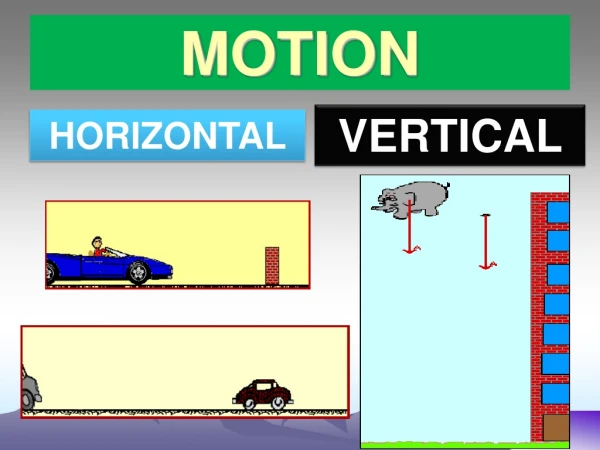
Motion Measuring Motion Motion Speed & Velocity Acceleration
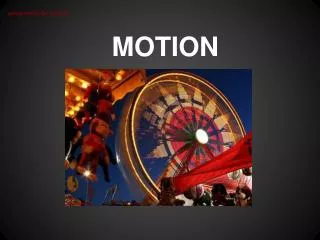
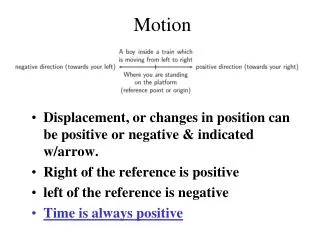
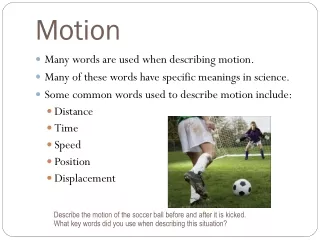
Motion • Motion is when an object changes position over time relative to a reference point. • Problem: • Is your desk moving? We need a reference point... • a nonmoving or moving point from which motion is measured
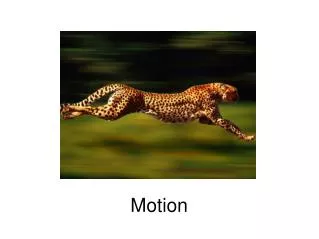
Motion • Superman Example • The speeding bullet is a movingreference point to Superman’s motion. • The tall building is the non-moving reference point when Superman leaps.
Reference point Motion Motion • Motion • Change in position in relation to a reference point.
Motion Problem: • You are a passenger in a car stopped at a stop sign. Out of the corner of your eye, you notice a tree on the side of the road begin to move. • What’s the problem? • You have mistakenly set yourself as the reference point.
d s t Speed • Speed • rate of motion • distance traveled by an object in a given amount of time Write Formula
Speed • Instantaneous Speed • speed at a given instant • Average Speed Write Formula http://www.physicsclassroom.com/mmedia/kinema/trip.cfm
Speed • Problem: • A storm is 10 km away and is moving at a speed of 60 km/h. Should you be worried? • It depends on the storm’s direction!
Velocity • Velocity • speed of an object in a given direction • changes when speed and/or direction changes • Examples: • The car’s velocity was 104 km/h N (about 65 mph N). • John’s velocity was 1 m/s S (about 2.2 mph S) • The runner’s velocity was 37 km/h W (about 23 mph W).
Distance-Time Graph A B Graphing Motion • slope = • steeper slope = • straight line = • flat line = speed faster speed constant speed no motion
Distance-Time Graph A B Graphing Motion • Who started out faster? • A (steeper slope) • Who had a constant speed? • A • Describe B from 10-20 min. • B stopped moving • Find their average speeds. • A = (2400m) ÷ (30min) A = 80 m/min • B = (1200m) ÷ (30min) B = 40 m/min
vf - vi t a Acceleration • Acceleration • the rate of change of velocity • change in speed and/or direction Write Formula a: acceleration vf: final velocity vi: initial velocity t: time
Acceleration • The velocity can change even when the speed is constant! Examples: 25 m/s S 25 m/s E 55 m/s W 20 m/s W
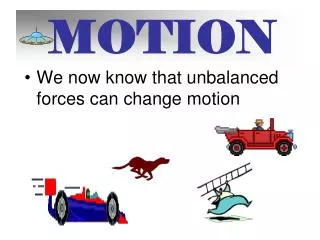
Acceleration • Positive acceleration • “speeding up” • Ex. 5 km/h 25 km/h • Negative acceleration (Deceleration) • “slowing down” • Ex. 25 km/h 5 km/h
Distance-Time Graph Graphing Motion • Acceleration is indicated by a curve on a Distance-Time graph. • Changing slope = changing velocity
Speed-Time or Velocity-Time Graph Graphing Motion • slope = acceleration • “+” velocity = speeds up • “-” velocity = slows down • Straight line = constant acceleration flat line = constant speed
Speed-Time or Velocity-Time Graph Graphing Motion Specify the time period when the object was... • slowing down • 5 to 10 seconds • speeding up • 0 to 3 seconds • moving at a constant speed • 3 to 5 seconds • not moving • 0 & 10 seconds