

SlideServe
Menu
Préférences
© SlideServe · v2026

Maps & Distortion

ryan-shepherd avatar
15 diapositives · 300 Views · Oct 25, 2014

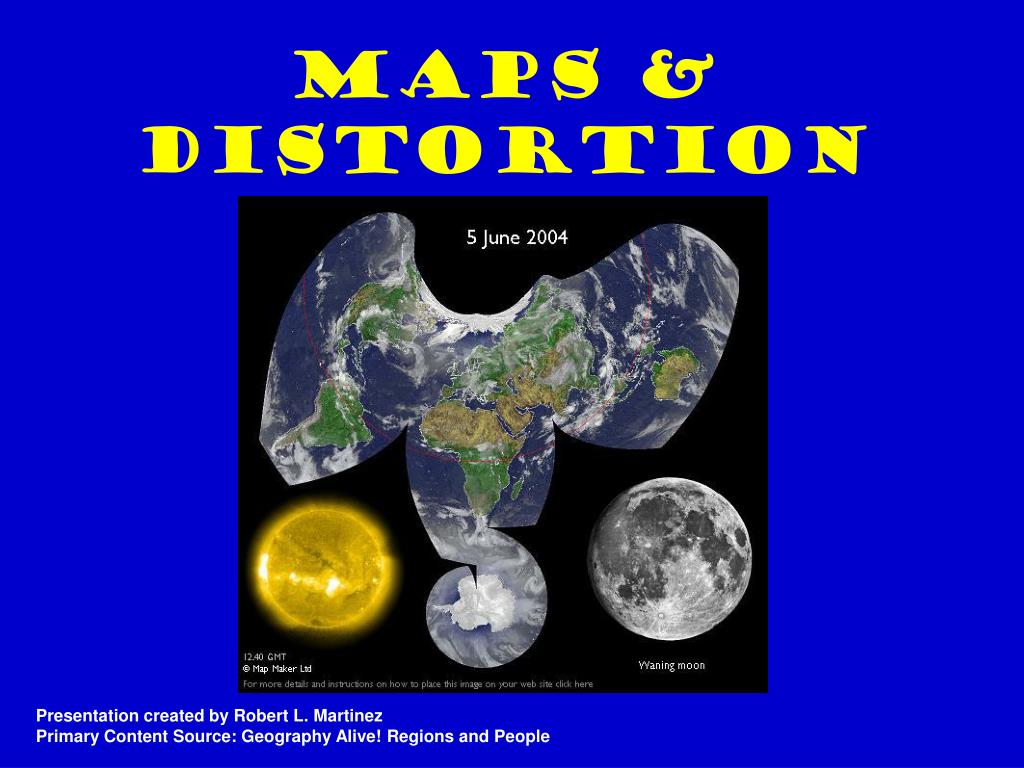
Maps & Distortion. Presentation created by Robert L. Martinez Primary Content Source: Geography Alive! Regions and People. Geographers use maps to show important features of Earth, such as its oceans and continents. But every flat map of Earth involves some distortion.
Maps & Distortion - slide 1
01 / 15Maps & Distortion
1 / 17

Télécharger la présentation

Maps & Distortion
Une image / un lien ci-dessous est fourni (tel quel) pour télécharger la présentation

Politique de téléchargement : le contenu du site vous est fourni TEL QUEL pour votre information et votre usage personnel ; il ne peut être vendu, concédé sous licence ni partagé sur d’autres sites sans l’accord de son auteur.Le contenu vous est fourni TEL QUEL, pour votre information et votre usage personnel uniquement. Téléchargez la présentation en cliquant sur ce lien. Lors du téléchargement, si vous ne parvenez pas à télécharger une présentation, l’éditeur a peut-être supprimé le fichier de son serveur.Pendant le téléchargement, si vous ne parvenez pas à obtenir une présentation, le fichier a peut-être été supprimé par l’éditeur.

F I N

Plus de contenu associé

Transcription de la présentation
  1. Maps & Distortion Presentation created by Robert L. Martinez Primary Content Source: Geography Alive! Regions and People

  2. Geographers use maps to show important features of Earth, such as its oceans and continents.

  3. But every flat map of Earth involves some distortion.

  4. As a result, the size or shape of landmasses or large bodies of water may be distorted, and the distance between places may not be accurately shown.

  5. To deal with distortions, mapmakers use different map projections. Many projections are named after the mapmakers who designed them.

  6. For example, Arthur Robinson designed the Robinson projection. It is a popular projection because it balances the distortions of size and shape, resulting in a fairly accurate picture of the world.

  7. Lambert Projections show polar areas that other maps distort. A Lambert projection is a circular map.

  8. It shows size accurately at its center, but not distance or shape. It is good for showing the areas around the North and South pole.

  9. Most other map projections distort the shape and size of the Arctic and Antarctica.

  10. Mercator Projections show direction but distort size. Gerardus Mercator designed his map projection in 1569. It shows directions between places accurately near the equator.

  11. But it distorts the size of continents, especially near the North and South poles. This is called area distortion.

  12. Eckert IV Projections show size but distort shape. The Eckert IV projection is an equal-area map.

  13. Equal-area maps show the sizes of places accurately. However, they distort shape near the poles. This is called shape distortion.

  14. Goode’s Homolosine Projections show continents but distort oceans. These maps use a trick to help us see how the continents compare in size.

  15. It deletes bits out of the oceans. This allows the continents to stretch without distorting their shapes. But it distorts the shape and size of the oceans.