Download

1 / 28
280 likes | 432 Vues
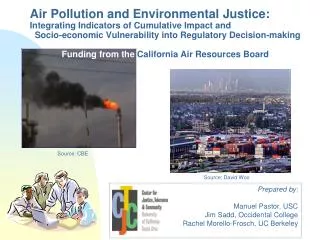
Source: CBE. Source: David Woo. Air Pollution and Environmental Justice: Integrating Indicators of Cumulative Impact and Socio-economic Vulnerability into Regulatory Decision-making Funding from the California Air Resources Board . Prepared by: Manuel Pastor, USC

E N D
Source: CBE Source: David Woo Air Pollution and Environmental Justice: Integrating Indicators of Cumulative Impact and Socio-economic Vulnerability into Regulatory Decision-makingFunding from the California Air Resources Board Prepared by: Manuel Pastor, USC Jim Sadd, Occidental College Rachel Morello-Frosch, UC Berkeley
Our Research Team • Manuel Pastor, Ph.D. in Economics, responsible for project coordination, statistical analyses, including multivariate and spatial modeling, and popularization • James Sadd, Ph.D. in Geology, responsible for developing and maintaining geographic information systems (GIS), including location of site and sophisticated geo-processing • Rachel Morello-Frosch, Ph.D. in Environmental Health Science, responsible for statistical analysis, health end-points, and estimates of risk.
Project Summary: Integrating Indicators of Cumulative Impact and Community Vulnerability into Regulatory Decision-making Address data and analytical needs for implementation of 2004 EJ Working Group Recommendations • Analyze air pollution data for disparities statewide and regionally (facility location, exposures, estimated health risks) • Examine air pollution data in relation to health (birth outcomes) • Conduct local-scale study utilizing community-based participatory research (CBPR) methods to: • ‘ground-truth’ information from emissions inventory data • Conduct PM sampling using low cost monitors • Develop indicators of cumulative impact and community vulnerability/resilience using existing data sources • Relevance for research, policy, and regulation • Develop screening methods with indicators to flag locations and populations that may be of regulatory concern for disparate impact • Consider alternative siting scenarios for CEC
Framework Study: Data Sources • Toxic Release Inventory – annual self-reports from point facilities, with analysis attempting to separate out carcinogenic releases, and facilities geo-coded as of 2003. The TRI data is standard in national studies although much analysis is flawed due to poor geographic matching. • NATA – National Air Toxics Assessment (1999). Takes into account national emissions database with modeling of stationary, mobile, and point sources. Public available NATA fails to account for cancer risk associated with diesel; we apply risk factors to modeled diesel to complete the California picture.
At First Glance . . .TRI Facilities Relative to Neighborhood Demographics
Multivariate analysis of proximity to a TRI facility: Considering all the factors together, a neighborhood is more likely to be near a TRI if: TRI Air Releases: Race, Income, and Land Use Together • It has more African American or Latino residents • It is lower income • It has lower home ownership rates • Its land use is more industrial • It has more non-English speakers
What About Ambient Air Toxics? • This category of pollutants come from a diverse array of sources • Stationary: large industrial facilities and smaller emitters, such as auto-body paint shops, chrome platers, etc. • Mobile: Cars, trucks, rail, aircraft, shipping, construction equipment • Important because largest proportion of estimated cancer risk (70% in the Bay Area) is related to mobile emissions
U.S. EPA’s National Air Toxics Assessment (NATA) Gaussian dispersion model estimates long-term annual average outdoor concentrations by census tract for base year 1999. Concentration estimates include: • 177 air toxics (of 187 listed under the 1990 Clean Air Act) • Diesel particulates The model includes ambient concentration estimates from mobile and stationary emissions sources: Manufacturing (point and area) • e.g., refineries, chrome plating Non-Manufacturing (point and area) • e.g., utilities, hospitals, dry cleaners Mobile (on road and off road) • e.g., cars, trucks, air craft, agricultural equipment Modeled air pollutant concentration estimates allocated to tract centroids.
1999 NATA Estimated Cancer Risk (All Sources) by 2000 Census Tracts, 9-County Bay Area
Race, Income, and Land Use Together . . . Considering all the factors together, the levels of estimated cancer risk and respiratory hazard from air toxics is higher if: • It is has more residents of color • It is lower income • It has lower home ownership rates • Its land use is more industrial • It is more densely populated
Community-based Local Scale Study • Overview: • Community-based • Done in conjunction with Communities for a Better Environment • Partners in design, data collection, interpretation • Identify/locate sources of community concern • Also work with UC Berkeley professors on project, including potential deployment of cheap, portable and accurate monitors for pilot study for community-based PM air monitoring
HegenbergerCorridor study site 0.5 miles
HegenbergerCorridor study site 880 0.5 miles
17 Develop Screening Methods • Use analytical results to develop indicators of cumulative impact and community vulnerability that would be: • Applicable to various geographic levels • Transparent, quantifiable, understandable and relevant to policy-makers and communities • Can be derived from existing data sources • Indicators will be reviewed by community EJ groups (along with CARB staff) • Integrate into an environmental justice screening methodology which could be used for: • regulatory decision-making • enforcement activities • community outreach • Identify areas for special regulatory attention • ‘Greenlining’ assessment
Details of Analysis • Map only residential land use and schools • This is where exposure takes place • Sensitive land use categories • ARB land use guidelines • schools, child and healthcare facilities • Census demographics at block group level • These two areas intersected to create “sliver” polygons of known demographics and land use • Proximity score – assumes impact if polygon centroid is located within one mile radius of hazard • Four levels of indicators: • Proximity to Hazards • Land Use categories • Health Risk Indicators • Social Vulnerability Indicators
Hazards Indicators • Toxic Release Inventory 2003 • Most TRI sites replicated in other State ARB databases (CHAPIS and AB2588) • Plan to replace with EPA RSEI (1987-2005 layers of toxicity- and population-weighted hazard scores • Chrome Platers • CHAPIS • AB2588 “hot spots” • Hazardous Waste TSDs (DTSC) • Federal Superfund sites • State response sites • Voluntary cleanup sites
Land Use Indicators • Rail yards and Railroads • Airports • Ports • Refineries • Distribution centers (intermodal facilities) • Parks/recreation facilities, open space • Sensitive land uses • Childcare facilities • Healthcare facilities • Schools • Traffic density– not yet implemented • CalTrans AADT and truck counts • Mobile sources risk included in NATA health risk measures (below) • Tree canopy: not yet implemented22
22 Cumulative Impact: Land Use Indicators
Health Risk Indicators – • Polygon receives indicator if score is greater than or equal to one standard deviation above mean for LA County • NATA 1999 (National Air Toxics Assessment) • Total Cancer Risk from all pollutants • Respiratory Hazard from all air pollutants • Logarithmic distribution of data values- scores transformed • ARB Estimated Inhalable Cancer Risk 2001 • Calculated from modeled air toxics concentrations using emissions from CHAPIS • http://www.arb.ca.gov/toxics/cti/hlthrisk/hlthrisk.htm • Corrected this data to more accurately record “hot spots” • Asthma hospitalization rate • zip code level data from Ca Dept of Health Services • uneven geographic coverage • Birth outcomes –not yet implemented
Social Vulnerability Indicators Polygons receive indicator if part of a block group in the disadvantaged quartile Percent eligible to vote Percent non citizen residents Percent linguistically isolated households (no one in household speaks English well) Percent residents of color (non-Anglo) Percent residents at below 2X nationwide poverty level Per capita income Educational attainment – percent high school education or less
Cumulative Impact: Sum of Multiple Hazards, Health Risks, and Social Vulnerability in Los Angeles
Future Directions for Project • Continue with health impacts assessment, particularly birth outcomes • Complete environmental justice assessment of state, controlling for spatial autocorrelation and other statistical issues • Present and get feedback on screening method – taking into account tractability as well as sophistication • Complete local study to check community issues and results against secondary databases that could be used in screening approaches