Download
1 / 35
350 likes | 452 Vues
CAEM – Competitive Energy Markets Optimal Provision of New Electric Load Thomas R. Casten Chairman & CEO Primary Energy, LLC. Scott Tinker, Director Bureau of Economic Geology August 4, 2003. Summary. Successful organizations agree on goals and mission, then concentrate on tactics.

E N D
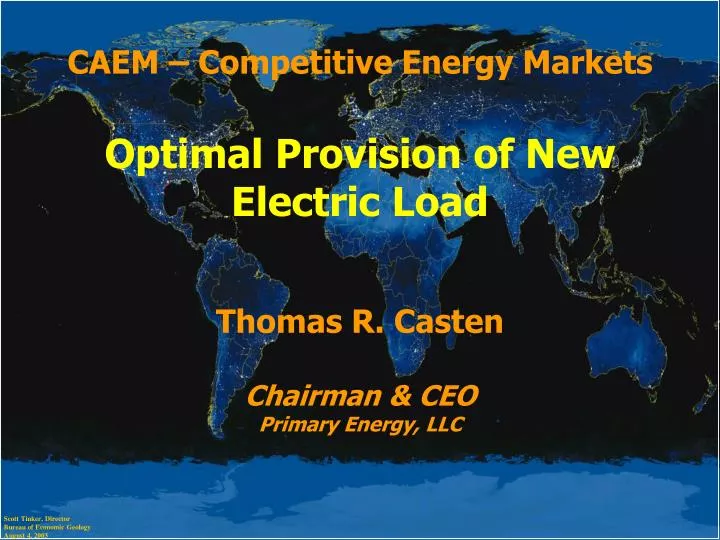
CAEM – Competitive Energy Markets Optimal Provision of New Electric Load Thomas R. Casten Chairman & CEOPrimary Energy, LLC Scott Tinker, Director Bureau of Economic Geology August 4, 2003
Summary • Successful organizations agree on goals and mission, then concentrate on tactics. • Start by understanding the environment. • Rising electric rates, rising fuel costs, concerns about excessive fossil fuel use and global warming, manufacturing job loss, and fear for our way of life. • Expect journalists and politicians to fix blame. • Figure out how to fix the problem • Determine consensus goals • Identify opportunities to advance goals • Quantify the problem and opportunity • Articulate a clear, elegant, mission
Three Key Power System Goals • Availability of Energy Services • Availability of Energy Services • Availability of Energy Services
Subordinate Power System Goals • Limit capital expenditure • Reduce rates • Reduce fossil fuel use • Reduce pollution • Reduce global warming • Reduce system vulnerability • Reduce manufacturing job loss
What is the Problem?Is it the conventional wisdom? • Large generation has economies of scale • All power will flow through wires • (New) ‘Technology is the Ticket’ President Bush, May 2005 • Free markets cannot provide the world’s most second most important service (Beer is first)
Assess the Power System • Did power industry chose optimal approaches in the past? • What is best way to meet expected US and world load growth? • What are the effects of 100 years of monopoly protection of electric distribution? • Compare options for meeting expected load growth
Pollution Waste Heat Transmission Line Losses 3 units (9%) 67 units Waste Energy Fuel 100 units = 33 units Electricity Conventional Central Generation Power Plant End User
Pollution 33 units Waste Energy 33 units Thermal Energy = 66 units Useful Work Fuel 100 units 33 units Electricity End User Site Combined Heat and Power CHP Plant Waste Heat Recovery
Capital Costs per Kilowatt, Central versus Decentralized Generation
Central Generation Paradigm Blinds Society to Cheapest, Cleanest Option:Recycling Industrial Energy
Defining Recycled Energy • Recycled energy is useful energy derived from • Exhaust heat from any industrial process; • Industrial tail gas that would otherwise be flared, incinerated or vented; and • Pressure drop in any gas
Conventional Industrial Site Electricity Finished Goods Process Fuel Waste Energy End User Site
Saved Energy Input Energy Recycling Plant Electricity Finished Goods Process Fuel Waste Energy End User Site Recycled Energy Electricity Steam Hot Water
US Industrial Recycling Potential • Recycled energy could supply 45 to 92 Gigawatts of fuel-free capacity – 13% of US peak • Recycled energy is as clean as renewable energy – no incremental fuel or emissions, but: • Capital costs are $500 to 1,500/kW, only 12% to 40% of solar and wind generation, • 90% load factors versus 14-40% for solar & wind • Recycled energy is both clean and economic option for new power generation. • EIA shows only 2.2 Gigawatts operating
Recycled Energy Case Study: Primary Energy • NiSource invested $300 million in six projects to recycle blast furnace gas, coke oven exhaust in four steel plants, 440 megawatts of electric capacity and 460 megawatts of steam capacity. • Steel mills save over $100 million per year and avoid significant air pollution • The CO2 reduction is equivalent to the uptake of one million acres of new trees. • The projects are profitable; were recently sold for $335 million to our firm
Has US Power Industry Made Optimal Decisions? • We analyzed major power generation technologies over 1988-2002 period • Central generation needs new T&D, DG needs 10% or less new T&D wires. • Assumed 8% cost of capital for CG, 12% for DG • Determined retail price/kWh needed in each year, given then current data.
Long Run US Marginal Costs/ MWh Central Generation Distributed Generation
Annual US Utility Additions of Electric Generating Capacity by Technology 1988 - 2002
Annual US IPP Additions of Electric Generating Capacity by Technology 1988 - 2002
Spread of 435,000 MW Built by US Electric Utilities 1973 - 2002
Percentage of Electricity from CHP Plants in Selected Countries (2004)
Conclusion of Historical Study • Electric monopolies limited choices to central plants, ignoring cheaper and cleaner distributed generation options • IPP companies built DG under PURPA rules, but shifted to central generation with passage of EPACT • Neither monopolies nor IPP’s built projects to recycle industrial waste energy
What is Optimum Future Generation? • We modeled 8 scenarios to meet EIA projected US load growth through 2020 (43%) • Found each technology’s capital cost, performance, emissions for each year • Added 100% T&D for central generation, 10% for DG • Met load growth with 8 scenarios: all central, all DG and blended scenarios
Why does the power industry make suboptimal decisions? • Many barriers to market competition, can be likened to the layers of an onion • The core of the ‘onion’ is the universal ban on private wires. • There can never be effective competition when power cannot move except through the monopolist distribution wires • No polity in the world, to my knowledge, allows private electric wires.
Change the way the world makes power by persuading governments to remove all barriers to competitive generation and delivery of power and end monopoly protection of electric distribution. CAEM Mission (proposed)
Expected Results • Meet all consensus goals • Increase availability of energy services • Lower capital cost • Reduce power costs • Reduce pollution • Reduce fossil fuel use • Reduce system vulnerability • Reduce manufacturing job loss