Download
1 / 22
220 likes | 374 Vues
Mathematics of Biological Systems 4th Annual PIMS-MITACS . Mathematical model of inter-specific competition for two protozoan species. Hassan Khassehkhan, Ross Macdonald and David Drolet Supervisor: Rebecca Tyson. Outline. Description of the system

E N D
Mathematics of Biological Systems4th Annual PIMS-MITACS Mathematical model of inter-specific competition for two protozoan species Hassan Khassehkhan, Ross Macdonald and David Drolet Supervisor: Rebecca Tyson
Outline • Description of the system • Logistic growth and competition models (Lotka-Volterra) • Modified model • Long term behavior • Comparison of modified model with L-V model
Introduction Paramecium caudata Paramecium aurelia • Competition for the same food source (bacteria) • Good system to investigate the dynamic of two competing • species
Methods used by Gause • Pure culture of both species in controlled medium • Mixed culture • Daily estimation of population density for a period of • 25 days • Medium was changed daily to prevent depletion of • resources Objective Revisiting Gause’s data using extension of the Lotka-Volterra competition model
Model Pure cultures: logistic growth Mixed culture: Lotka-Volterra competition model
Logistic growth models: Parameter estimation r’s and K’s
L-V model: Parameter estimation β’s We found β values minimizing sum of square deviation between predicted and observed values
L-V model: possible outcomes Case 1: β12 < K1/K2 and β21 > K2/K1 Species 1 always out-competes species 2
L-V model: possible outcomes Case 2: β12 > K1/K2 and β21 < K2/K1 Species 2 always out-competes species 1
L-V model: possible outcomes Case 3: β12 > K1/K2 and β21 > K2/K1 Outcome depends on initial values N1(0)=N2(0) N1(0)=4 x N2(0)
L-V model: possible outcomes Case 4: β12 < K1/K2 and β21 < K2/K1 Co-existence and populations reach a steady-state
N2 N1 L-V model: phase plane analysis Coexistence at the stable steady-state N1=450 N2= 56
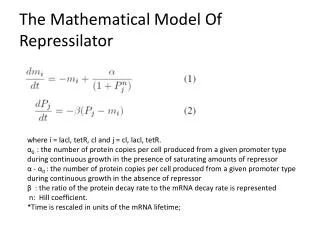
Modified competition model Where δ is a positive constant close to 0
Modified competition model: Long term behavior (steady-states) Using numerical method for finding steady state(Newton method) Steady state analysis based on estimated parameters
Modified competition model: Stability analysis r1 and r2 > 0 then, (0,0) unstable equilibrium λ1= -0.3667 λ2= -1.3316 Asymptotically stable
N2 N1 Modified competition model: Phase-portrait
Modified competition model: Numerical simulation
Modified competition model: Comparison with L-V Likelihood ratio test H0 : Both models fit data equally well H1 : One model fits the data better Chi square = 84.14, d.f.=2, p < 0.0001, thus, we reject H0 Residual sum of squares of the new model is less than that of L-V RSS of new model = 21 500 RSS of L-V = 119 713 RSS of the new model is 6 times smaller than that of L-V
Acknowledgement And the volunteer instructors