
Understanding Process Capability: Key Indices and Data Collection for Quality Control
E N D
Presentation Transcript
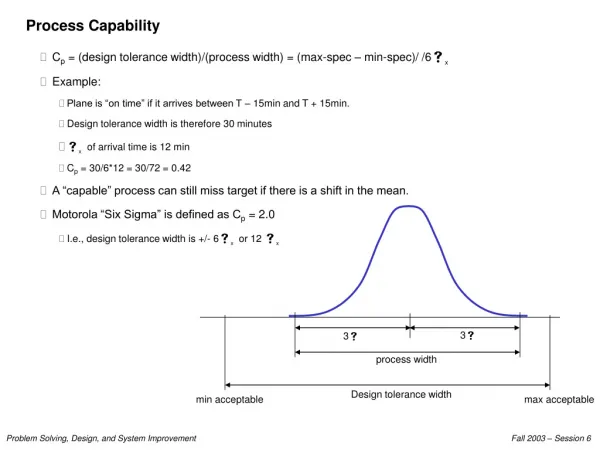
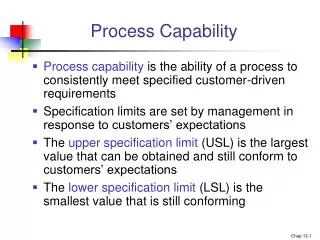
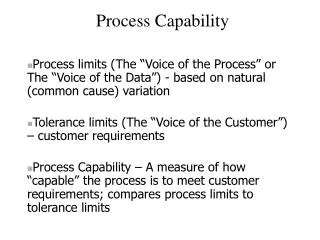
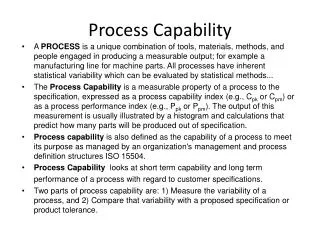
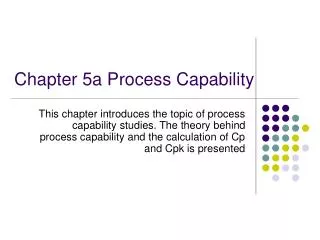
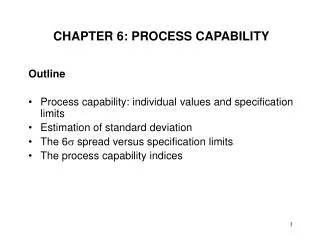
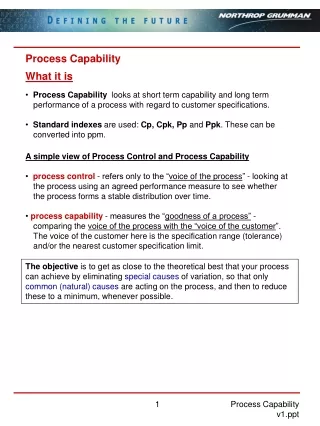
Introduction • A “capable” process is one for which the distributions of the process characteristics do lie almost entirely within the engineering tolerances or customer’s needs. • Process capability indices • Simple • Careful in use and interpretation • Two phases in a process capability study • Determining how to data are to be collected, and then collecting the data • Selecting 1 or more indices and performing the computations
7.1 Data Acquisition for Capability Indices • Data must come from an in-control process • The sample must be representative of the population • The sample size must be large enough • To assess the extent of the non-normality • To allow a non-normal distribution to be fit to the data • Process capability indices <> Process Performance indices
7.2 Process Capability Indices • Should be easy to compute • Should not be undermined by slight-to-moderate departures from normality
7.4 Distributional Assumption for Capability Indices • It is assumed that the observations have come from a normal distribution. • A normal distribution is also assumed when the capability indices are used.
7.5 Confidence Intervals for Process Capability Indices • Unless the sample size was large, it is desirable to also report a confidence interval for the index. • Lower confidence bound is more appropriate than a 2-sided confidence interval. • It is assumed that individual observations are used in computing the parameter estimates (7.5.1~7.5.4)
7.5.6 Nonparametric Capability Indices and Confidence Limits • Some quality characteristics such as diameter, roundness, mold dimensions, and customer waiting time will be non-normal, and flatness, runout, and % contamination will have skewed distributions. • Process capability indices are not robust to non-normality in the individual observations. • 4 approaches for non-normal distributions: • Robust capability index • Fit a distribution to a set of data and use percentiles in an index • Transform the data to approximate normal • Resample from the n sampled observations
7.5.6.3 Data Transformation • Data can be transformed so the transformed data will be approximately normally distributed. • Lognormal data
7.5.6.4 Capability Indices Computed Using Resampling Methods • Resampling methods have been used to approximate sampling distributions when no assumption is made of the distribution of the random variable. • Bootstrapping is one type of resampling. • Naïve bootstrap: keep the original sample size, resample with replacement • The standard bootstrap methods can not be relied on to produce a lower confidence limit for a capability index.
7.7 Capability Indices that are a Function of % Non-conforming
7.11 Process Capability Indices vs. Process Performance Indices
7.13 Software for Process Capability Indices • Minitab: