Download
1 / 25
250 likes | 332 Vues
Design ITWG ITRS-2001 Grenoble Meeting April 27, 2001. Mixed-Signal Roadmap. Figures of merit for four important basic analog building blocks are defined and estimated for future circuit design

E N D
Mixed-Signal Roadmap • Figures of merit for four important basic analog building blocks are defined and estimated for future circuit design • From these figures of merit, related future device parameter needs are estimated (PIDS table, owned by Design) and feedback is given Roadmap for basic analog / RF circuits Roadmap for device parameters (needs) … … … … A/D-Converter Lmin 2001 … 2015 Low-Noise Amplifier Voltage-Controlled Oscillator analog transistor gm/gds Power Amplifier
Low Power SOC Low Power Scenario Constant-power scenario: slower clock, fewer Tr, lower Vdd, …
New MPU Clock Model • Global clock: flat at 14 FO4 INV delays • FO4 INV delay = delay of an inverter driving a load equal to 4 times its input capacitance • no local interconnect: negligible, scales with device performance • no (buffered) global interconnect: (1) was unrealistically fast in Fisher98 (ITRS99) model, and (2) global interconnects are pipelined (clock frequency is set by time needed to complete local computation loops, not time for global communication - cf. Pentium-4 and Alpha-21264) • Local clock: flat at 6 FO4 INV delays • somewhat meaningless: only for ser-par conversion, small iterative structures, “marketing interpretation” of phase-pipelining • reasonable alternative is todelete from Roadmap • ASIC/SOC: flat at 40-50 FO4 INV delays • absence of interconnect component justified by same pipelining argument, and by convergence of ASIC / structured-custom design methodologies, tools sets • higher ASIC/SOC frequencies possible, but represent tradeoffs with design cost, power, other figures of merit • low information content reasonable alternative is to delete from Roadmap
Layout Density Models (“A” Factors) • Semi-custom Logic: Avg size of 4t gate = 32MP2 = 320F2 • MP is contacted lower-level metal pitch • 32 = std-cell height 8 tracks by width 4 tracks (avg NAND2) • whitespace factor; overall model scales quadratically • Custom Logic: 1.25x ASIC density • SRAM:used in MPU: A factor decreases with scaling; still evaluating • may see paradigm shifts in architecture/stacking; eDRAM, 1-T SRAM, … • peripheral overhead 70-100%; more exact model of form K*log(A)*B 200 180 160 140 120 SRAM Cell Area (F2) 100 80 60 A-Factor = 133.19 + 50.546F 40 20 0 0.1 0.15 0.2 0.25 0.3 0.35 0.4
Power Constraint Implications: Logic - Memory Balance Anomaly going from 45nm to 32nm due to constant Vdd Constant power or power density decreasing logic content #Tr Logic, SRAM won’t scale together as in current ITRS
Design Cost and Quality Requirement • Design cost of “largest ASIC” risesdespite major DT innovations • Other Dataquest numbers confirm memory content rising • We are developing metric, data, requirements for designquality
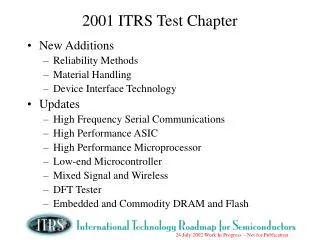
SYSTEM DRIVERS Chapter • Defines segments of silicon market that drive process and design technology • Along with ORTCs, serves as “glue” for ITRS • 4 Drivers: SOC (Japan), MPU (USA), DRAM (Korea), M/S (Europe) • SOC: driven by cost, power, integration • SOC: drives device requirements, packaging, I/O counts, … • SOC: same as “ASIC-LP” • Each section • Nature, evolution, formal definition of this driver • What market forces apply to this driver ? • For what technology elements (process, device, design) is this a driver ? • Key figures of merit, and futures • Participation of other ITWGs
DESIGN Chapter • Context • Scope of Design Technology • High-level summary of complexities (at level of “issues”) • Cost, productivity, quality, and other metrics of Design Technology • Overview of Needs • Driver classes and associated emphases • SOC, MPU, DRAM, MS • Resulting needs (e.g., power, …, cost-driven design) • Summary of Difficult Challenges • Detailed Statements of Needs, Potential Solutions • System-Level, Circuit, Logic/Physical, Verification, Test
MPU Diminishing Returns • Pollack’s Rule • In a given process technology, new uArch takes 2-3x area of old (last generation) uArch, and provides only 40% more performance (see Slide) • Slide: process generations (x-axis) versus (1) ratio of Area of New/Old uArch, (2) ratio of Performance of New/Old (approaching 1) • Slides: SPECint, SPECfp per MHz, SPECint per Watt all decreasing rapidly • Power knob running out • Speed == Power • 10W/cm2 limit for convection cooling, 50W/cm2 limit for forced-air cooling • Large currents, large power surges on wakeup • Cf. 140A supply current, 150W total power at 1.2V Vdd for EV8 (Compaq) • Speed knob running out • Historically, 2x clock frequency every process generation • 1.4x from device scaling (running into t_ox, other limits?) • 1.4x from fewer logic stages (from 40-100 down to around 14 FO4 INV delays) • Clocks cannot be generated with period < 6-8 FO4 INV delays • Pipelining overhead (1-1.5 FO4 INV delay for pulse-mode latch, 2-3 for FF) • Around 14 FO4 INV delays is limit for clock period (L1 $ access, 64b add) • Unrealistic to continue 2x frequency trend in ITRS
Performance Efficiency of Microarchitectures – Pollack’s Rule Area (Lead / Compaction) Growth (X) Performance (Lead / Compaction) Note: Performance measured using SpecINT and SpecFP 1.5 1 0.7 0.5 0.35 0.18 Technology Generation • Implications (in the same technology) • New microarchitecture ~2-3X die area of the last microarchitecture • Provides 1.4-1.7X performance of the last microarchitecture We are on the Wrong Side of a Square Law Intel: Gelsinger talk ISSCC-2001
MPU Clock Frequency Trend Intel: Borkar/Parkhurst
MPU Clock Cycle Trend (FO4 Delays) Intel: Borkar/Parkhurst
Memory/Logic Power Study Setup • Motivation: Is current ITRS MPU model consistent with power realities? Does it drive the right set of needs? • Ptotal = Plogic + Pmemory = constant (say, 50W or 100W) • Plogic composed of dynamic and static power, calculated as densities • Pmemory = 0.1*Pdensity_dynamic • power density in memories is around 1/10th that of logic • Logic power density (dynamic) determined using active capacitance density (Borkar, Micro99) • dynamic power density Pdensity_dynamic = Cactive * Vdd2 * fclock • fclock uses new fixed-FO4 inverter delay model (linear, not superlinear, with scale factor) • Cactive = 0.25nF/mm2 at 180nm • increases with scale factor (~1.43X)
Memory/Logic Power Study Setup • Static power model considers dual Vth values • 90% of logic gates use high-Vth with Ioff from PIDS Table 28a/b • 10% of logic gates use low-Vth with Ioff = 10X Ioff from PIDS Table 28a/b (90/10 split is from IBM and other existing dual-Vth MPUs) • Operating temp (80-100C) Ioff is 10X of Table 28a/b (room temp) • Width of each gate determined from IBM SA-27E library • 150nm technology; 2-input NAND = basic cell • performance level E: smallest footprint, next to fastest implementation W of each device ~ 4um • Weff (effective leakage width) for each gate = 4um • 0.8*Weff*Ioff (per um) = Ileak / gate (0.8 comes from avg leakage over input patterns)
Memory/Logic Study Setup • Calculate densities, then find allowable logic component (percent of total area) to achieve constant power (or power density) • Amemory + Alogic = Achip • recall that Achip is flat at 157 mm2 from 1999-2004, then increases by 20% every 4 years • Constant power and constant power density scenarios same until 65nm node (because chip area flat until then)
Power as a Constraint: Implications Using same constraints, calculate #MPU cores (12Mt/core) and Mbytes SRAM allowable (again, anomaly at 32nm due to constant Vdd)
Design Cost Requirement • “Largest possible ASIC” design cost model • engineer cost per year increases 5% per year ($181,568 in 1990) • EDA tool cost per year increases 3.9% per year ($99,301 in 1990) • #Gates in largest ASIC design per ORTCs (.25M in 1990, 250M in 2005) • %Logic Gates constant at 70% (see next slide) • #Engineers / Million Logic Gates decreasing from 250 in 1990 to 5 in 2005 • Productivity due to 7 Design Technology innovations (3.5 of which are still unavailable) : RTL methodology; In-house P&R; Tall-thin engineer; Small-block reuse; Large-block reuse; IC implementation suite; Intelligent testbench; ES-level methodology • Small refinements: (1) whether 30% memory content is fixed; (2) modeling increased amount of large-block reuse (not just the ability to do large-block reuse). No discussion of other design NRE (mask cost, etc.). • #Engineers per ASIC design still rising (44 in 1990 to 875 in 2005), despite assumed 50x improvement in designer productivity • New Design Technology -- beyond anything currently contemplated -- is required to keep costs manageable
Design Cost Requirement • Source: Dataquest (2001)
ASIC Memory Content Trends • Source: Dataquest (2001)
Design Quality Requirement • “Normalized transistor” quality model • speed, power, density in a given technology • analog vs. digital • custom vs. semi-custom vs. generated • first-silicon success • other: simple / complex clocking, … • developing quality normalization model within MARCO GSRC; VSIA, Numetrics, others pursuing similar goals • Design quality: gathering evidence, will have metric, historical trend / needs table) • Design quality, and quality/cost, will show red bricks?