Download
1 / 47
470 likes | 615 Vues
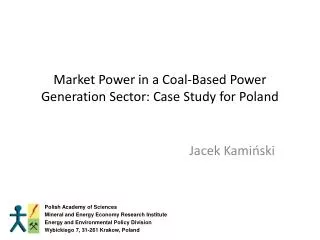
Market Power in a Coal-Based Power Generation Sector: Case Study for Poland. Jacek Kamiński. Polish Academy of Sciences Mineral and Energy Economy Research Institute Energy and Environmental Policy Division Wybickiego 7, 31-261 Krakow, Poland. Outline of the presentation.

E N D
Market Power in a Coal-Based Power Generation Sector: Case Study for Poland Jacek Kamiński Polish Academy of Sciences Mineral and Energy Economy Research Institute Energy and Environmental Policy Division Wybickiego7, 31-261 Krakow, Poland
Outline of the presentation • Background and aim of the study • Overview of the Polish power sector • Applied methodology • Results • Conclusions
Background of the study • Market reforms started in 1989: commercialisation, unbundling, TPA ruleand partialprivatisation • Several consolidations of State-owned power plants (2000, 2004, 2007) • Currently a 30% market shareof the largest power producer– potential for market power • Lack of quantitative analysis of market power in the Polish power generation sector: • Lack of anyquantitativetool for market powerstudies
Aim of the study • To develop a game theory-based market equilibrium model of the Polish power generation sector • To carry out an analysis of market power in the Polish power generation sector based on modelling approach
Installedcapacity [%] Total installedcapacity: approx. 35 GW
Electricitygenrationmix [%] Annualelectricityproduction: approx. 150 TWh
Methodology: gametheory-based model of the Polish power generation market • Partialequilibrium model of the wholesalepowergenerationmarket • The Cournot approach with Conjectural Variations • The model captures different market structures basedon strategies of market players (strategic behaviour, price-taker) • 14 hard coal-based public power plants, 6 brown coal-based public power plants and 33 public CHPs: • as individual units or within energy groups • 12 loads4 seasons (Q1, Q2, Q3, Q4) and 3 loads (peak, mid, base) • Copperplate model of transmission network • Developed with GAMS as a Mixed Complementarity Problem (MCP), solution found by the PATH solver
KKT conditions (1) • Derivative of the Lagrangefunction:
KKT conditions (2) • Demand for power: • Capacityconstraint: • Emissionconstraint:
Measures, comparedunderdifferentscenarios • Gross electricity production [TWh] • Marketprice of electricity [€/MWh] • Consumerand producer surpluses[M€] • Net social surplus and the dead weight welfare loss [M€] • Electricityproduction fuel-mix [TWh] • SO2, NOX, CO2emissions from the power generation sector [kt] or [Mt] • Fuelsupplies to the power sector (separately for hard coal, brown coal, etc.) [PJ]
Fuelsupplies: differencewhen compared withthe REF scenario [PJ]
Conclusions • Existingpotential for market power hasa significant impact on wholesale electricity prices and production volumes • underthe competitive scenario the average wholesale electricity price would be 5.7€/MWh lower and total electricity production would be almost 10 TWhhigher • As a result of market power the transfer of surplusesisobserved. Under the COMP scenario: • the consumer surplus would decrease by 803 M€ and the producer surplus would increase by 695 M€ • the estimated dead weight welfare lossof 108 M€ – the net social loss resulting from market power in the power generation sector.
Conclusions • The power generation sectorbased on coal has a significantlyreducedresponsiveness to changes in fuel prices • Imposinga carbon tax would not lead to a significant change in CO2 emissions in the short-run • long-term modelrecommended • Indirectimpact of market power on the emissionslevels
Market Power in a Coal-Based Power Generation Sector: Case Study for Poland Jacek Kamiński Polish Academy of Sciences Mineral and Energy Economy Research Institute Energy and Environmental Policy Division Wybickiego7, 31-261 Krakow, Poland
Key KKT conditions (3) • Renewable electricity production constraint:
CapacityFactor(p) InstalledCapacity(p) Losses(p) Elasticity(l) Conjectural Variation(p,c) CapacityConstraint(p) ShpCapacity(p,l) Production(p,l) Demand(l) EmissionConstraint(m) Price(l) Emission Limit(m) Fuel Supply(s) FuelDemand(f) MarketShare(p,c) FuelPrice(f) EmissionFactor(p,m) ShpEmission(m) FuelCost(s) FuelCapacityConstraint(s) Legend: Fuel Supplier Profit(s) Data ShpFuel Capacity(s) FuelCapacity(s) Scenario elements Profit(p,l) Renewables Constraint Balances VariableCost(p) Efficiency(p) Minimum share of Renewables Variables ShpRenewables
Profit/demandfunctions • Profit function • Demandfunction
Concentration Ratio (CR1) Polska Grupa Energetyczna (30% moc zainst.) (36-39% produkcja e.e.) BOT GiE (22% moc zainst.) (31-33% produkcja e.e.) El. Bełchatów (18%) PKE (14%)
Concentration Ratio (CR3) PGE (30%/36-39%) Tauron (15%/15%) EdF (9%/10%) Bełchatów (18%) PKE (13%) PAK (9%) BOT GiE (22%/32%) PKE (14%/13%) EdF (9%/10%) PKE (14%) Bełchatów (13%) Kozienice (8%)
Residual Supply Index PKE BOT GiE PGE
MCP • MCP is a generalization of a pure nonlinear complementarity problem (NCP). • In an MCP, a vector x must be determined, so that:
MCP • The MCP formulation also allows for non-zero lower bounds as well as upper bounds to the variables for which a solution must be determined: