Download
1 / 60
610 likes | 867 Vues
Casting the Safety Net – Fish or Cut Bait? Capturing Precursor Safety Events. Indiana Association for Healthcare Quality 2010 Annual Conference April 30, 2010. Martha Boutin White, RN, BSN, MBA, Patient Safety Officer Memorial University Medical Center Savannah, GA

E N D
Casting the Safety Net – Fish or Cut Bait? Capturing Precursor Safety Events Indiana Association for Healthcare Quality 2010 Annual Conference April 30, 2010
Martha Boutin White, RN, BSN, MBA, Patient Safety Officer Memorial University Medical Center Savannah, GA Sherry L. Sweek, RHIA, CPHQ, CPMSM, Director of Quality Improvement Southeast Georgia Health System Brunswick, GA
Objectives • Define Precursor Safety Events including errors of omission • Explain leverage points introduced to increase reporting and decrease errors • Share results and data analysis • Review lessons learned • Discuss next steps and recommendations
Overview • Memorial’s safety journey • 2008 Safety refocus • Precursor safety events project • How we got started • Problems we encountered • Current safety performance • Next steps
Memorial University Medical Center • Two-state healthcare organization servicing a 35-county area in southeast Georgia and southern South Carolina • Four-year medical school on campus affiliated with Mercer University School of Medicine • 530-bed tertiary hospital with Core Services: • Level 1 Trauma Center • Level 3 Neonatal Intensive Care Nursery • Heart & Vascular Institute • Curtis & Elizabeth Anderson Cancer Institute • George & Marie Backus Children’s Hospital • Rehabilitation Institute
Gaining Direction in Our Safety Journey • Conducted Mandatory Error Prevention Training (Team Members, Team Leaders and Physicians) • Enhanced Analysis of Events (Root Cause / Common Cause) • Established and Enforced “RED Rules” for Operating Room, Invasive Procedures, and overall Hospital Global “RED Rules” • Implemented Incident Scoring System (Compliance & Patient Outcome) • Incorporated Increased Reporting Metric (ROSI) in Team Leader Bonus Structure • Created Safety Coach Program and Dedicated FTE Positions
Straying Off Course: 2006-2007 • Dealt with OIG Investigation for Alleged Stark Violations and 22 surveys in an 18 month time period • Observed 31% Decreased Incident Reporting • Discounted Increased Sentinel Events Due to Joint Commission Definition Changes • Failed to Recognize System Wide Issues and Implement Changes • Experienced Instability with Loss of Patient Safety Officer, COO, CNO, CFO, Director of Quality, VP of Quality and Patient Safety • Moved Away from Safety to Financial Situations by All Leaders • Not Cognizant of the Impact of Financial Woes on Safety
MUMC Organizational Complacency Create a Safe Day Stage 5: Collapse Stage 4: Denial Stage 3: Blindness Stage 1:Good Operations Stage 2: Self Satisfaction
Total Time to Complete a Root Cause Analysis • Determination of SSE – 6–8 hours (x2) • Communicating to stakeholders - 6 • Charter – 1 hour • Interviews – 1 hour each (x10x3) • Swiss Cheese diagram – 1 hours • Task Analysis – 3 hours • Event Time Line – 2 hours (x2) • Team Meetings – 2.5 hours each (x8x3) • Report Completion – 2 hours • Pre-report with Champion – 1 hour (x3) • Presentation of Report – 1.5 hours (x4) • Coding the event in database – 1 hour Total:133 hours/month
“We’re gonna know all there is to know about the PSE business”
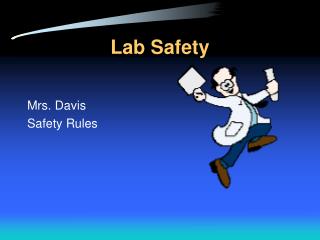
SM SafetyEventClassification SEC Serious Safety Event Variation in standard of care Reaches the patient Death or major harm Cause Analysis Level: RCA Serious Safety Events Precursor Safety Event Variation in standard of care Reaches the patient Minimal or no harm Cause Analysis Level: ACA Precursor Safety Events Near Miss Variation in standard of care Does not reach the patient Cause Analysis Level: Trend, ACA Near Miss
A precursor safety event is a variation in care that reaches the patient but does not cause permanent harm Delay in treatment Failure to recognize Improper Pt ID Inadequate check Inadequate handoff Inadequate monitoring Missed medication Missed treatment Omitted Action Wrong dose Wrong medication given Wrong treatment What is a Precursor Safety Event?
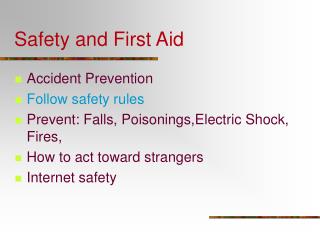
Redirecting the Focus to Prevention Nurse skips chart check Pharmacy Tech fills order Pharmacist enters wrong dose PSE SSE Physician writes ambiguous order NM NM NM Nurse administers 10X dose (medication overdose) Barriers to Harm
Did We Have the Right Equipment? • License – Approval of Quality & Patient Safety Committee and Board of Directors to fish for PSEs • Net – Decree to increasing the number of incident reports became a strategic objective • Bait – Rewards for Safety Saves • Catch – Precursor Safety Events with coded information to drive improvement
We Pulled Up Full Nets • 2009: 8,509 incidents, 2 Serious Safety Events • 709 incidents per month • 210 incidents per month visitor issues, workers comp or physician complaints • 144 incidents per month near misses • 355 PSEs per month • Everyone gets to eat….
Beware of Shifting Tides • Fishy Headlines • Paradigm Shift Required • Risk Management Shares Information and Promotes Transparency • No Compass on How to Navigate • Internal Sonar Better Than Nothing
Risk Throws in a Flotation Device • Began Weekly Meeting with Risk • Review Precursor Safety Events • Verify Profession Involved • Define Inappropriate Act • Determine Apparent Cause Reports • Code Completed A/C reports • Review Safety Saves for PSEs
Back on Dry Land… • Assign Apparent Cause Reports in Safety Database • Have Management Engineers Customize Database to House PSE information • Compile Safety Saves and Produce Certificates
Is It a Keeper? • WHEN I HAD FINISHED, I BROUGHT pt. N WAS NO LONGER WITH PT AND PT WAS NOT MONITORED. PT INITIALLY CAME TO ER FOR TRAUMA TO FACE/HEAD FROM FALL. PT WAS NOT AWAKE, OR COMMUNICATIVE WITH ME WHEN I BROUGHT HER TO THE SCANNER. I WAS ABOUT TO GET ASSISTANCE WITH MOVING THE PT WHEN SHE coded
We Fish, They Feast • Generated Department Specific PSE Report • Included PSE Reports to Senior Leadership Rounds • Send PSE Reports to Managers, Directors and Safety Coaches • Modified PSE Report Format to Incorporate Voice of Customer
Man Overboard!!! • Hard to Stay the Course When Everyone Wants to Change Direction • Teach Them to Fish, Teach Them to Fish, Teach Them to Fish • Safety Drills • Swiss Cheese of Errors • Reinforce Error Prevention Techniques • Required Actions from Senior Leadership, Directors, Managers
I Caught a Fish This BIG… • Added PSE to Monthly Dashboard • Established Procedure for Accountability for Apparent Causes Completion • Determined Frequency of PSE Report to Quality Oversight Committee and Board of Directors • Conducted and Presented Common Cause Analysis Based on PSE Data
My Fish is Bigger Than That • Safety Rounding Tool Modified Each Month Based on Data from PSEs • STAR (Stop, think, act, review) • Safety Huddles • Patient Identification • Pre Rounding Huddle for Unit Specific Trend or Unresolved Issues • Behavior Based Monitoring Compliance Included on Report and in Dashboard
Looking First for Tears in The Net • Included data from October 2008 through May 2009 • Data used to generate reports for Patient Safety Rounds • 734 Precursor Safety Events • 869 Inappropriate Acts • Majority of Inappropriate Acts are committed by “Sharp End” care givers • All PSE’s coded based on event description and additional investigation emphasizing coding data from: • Apparent Cause Reports • Level 1 or Level 2 PSEs (temporary or minor harm) • 70% of PSEs only partially coded due to incomplete information
Data & A/C Mine Data A/C reports Approval for 6 mth study MAXPI PSE Report & Rewards Saves & MAX Blitz
“PSEs are like a box of chocolates. You never know what you’re gonna get….”
The Radar Suggests… • Sharp End Employees are Identified Most Often in Committing Inappropriate Acts • RNs, Pharmacists and Physicians • Common Threads Among all Professional groups • S.T.A.R. (Stop, Think, Act, and Review) • Rule Based Errors (Patient ID Error) • Limitations of The Data • Self-reported • Incomplete Data • Some Areas Still Perceive Reporting as Punitive
STAR as an Effective Error Prevention Tool – High Risk Areas • Above represent the units that have most frequent rounds • L&D EPT Stop When Unsure could have prevented 9 additional PSE’s
Charting the Course • Formed Two Ad-Hoc Teams on: • Integrating S.T.A.R. into Patient Safety Practice • Maximizing Report Quality in MAXPI • Team Initiatives Included on Top Ten List • Team Skippers were CNO and CFO • Development Center – Team Facilitation • Team Recommendation to Quality Oversight Committee with Implementation Plan
Stay Within the Bouys • Added Precursor Safety Events Goals to Safety Improvement Plan • Included PSE Metrics on Monthly Dashboard • Reported PSE Trends Quarterly to Quality Oversight Committee and Board • Conducted annual PSE Common Cause Analysis
2009 Common Cause Navigation • 1102 Precursor Safety Events • 1310 Inappropriate Acts • 17.5% of PSEs with Temporary or Minor Harm • Results Mirror Common Cause from August 2009 • Five Straight Months with 100% of Apparent Cause Reports Completed in Two Weeks • 35%-45% of Inappropriate Acts are with Medication Nutrition Process • 50% of Inappropriate Acts could have been Prevented by Using STAR
PSE Error Prevention Techniques Nearly 50% of all inappropriate acts could have been prevented utilizing S.T.A.R.
S.T.A.R - RN Utilizing STAR effectively could reduce 40% of inappropriate acts related to the medication and nutrition process.