Download
1 / 25
250 likes | 438 Vues
Role of Ammonia in Formation of Secondary Particulate Matter: A Study from Kanpur, India. Mukesh Sharma, Shyam Kishore, Tejas, and Sailesh Environmental Engineering and Management Program Department of Civil Engineering Indian Institute of Technology Kanpur, Kanpur 208016, India

E N D
Role of Ammonia in Formation of Secondary Particulate Matter: A Study from Kanpur, India Mukesh Sharma, Shyam Kishore, Tejas, and Sailesh Environmental Engineering and Management Program Department of Civil Engineering Indian Institute of Technology Kanpur, Kanpur 208016, India Indoflux Meeting Chennai July 12-16, 2006
Case Study – Secondary Particle Formation • Should Air Quality Measurements be Subset of Indo-flux Measurements – if yes, how?
Kanpur Delhi ug/m3 Mumbai Kolkata BACKGROUND National Air Quality Program Suggests two Issues • Consistently high particulate matter( PM) levels • Consistently rising levels of oxides of nitrogen (NOx) ______________________________________________ • Ozone • VOCs, BTX, PAHs, Dioxins, Metals • Water Soluble Ions
Time Series : 1998-2004 New Delhi Average PM10: 400 ug/m3 d[NOx]/dt = 10 ug/m3-yr Summer PM10 Variation NOx , SO2and PM10 Interlinked Summer NOx Variation
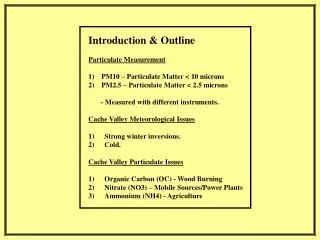
Objectives of the Case - study to understand the role of NO2, NH3, SO2, HNO3, temperature and humidity in formation of particulate sulfate and nitrate. This is assessed in terms of: • Inhalable PM10, NO2, HNO3,NH3 • Water soluble ion: NO3-,SO42-,Cl-,NH4+,Na+,K+,Ca2+ ,Mg2+ ; in PM10
Vikash Nagar Agriculture Fields Population ~ 3 million
COARSE MODE NITRATE NaCl HCl SOIL NaCl SOIL NO HNO x FINE MODE NITRATE (NH NO ) 3 NO HNO x 3 FINE MODE NITRATE 3 4 NH 3 NH 3 SO 2 SO H SO (NH ) SO 2 2 4 4 2 4 H SO (NH ) SO 2 4 4 2 4 Formation of Secondary Particles (Seinfeld, 1996) Fine Mode NH3 (g) + HNO3 (g) ↔ NH4NO3 (s) Coarse Mode CaCO3 (aq) +2 HNO3 (g) → Ca (NO3)2(s) +H2O +CO2 (g)
RECAP • Summer Vs Winter • NO3-, SO42-, NH4+, K+ significantly high in winter • Ca2+, Mg 2+, HNO3 , PM10 significantly high in summer • Winter: Day Vs Night • NO3-, SO42-, NH4+, K+, PM10, HNO3 significantly high in winter day • Ca2+, Mg 2+, Cl -, Na +, NH3 no significant difference • Summer: Day Vs Night • SO42-, NH4+, K+ , significantly high in summer night • N02 ,Ca2+, Mg2+,PM10 ,HNO3 NH3 significantly high in summer day • NO3- , Cl- , Na+ no significant difference
Ionic balance for summer and winter µ equ/m3 • Difference in cation and anion: 17% in winter and 24% in summer • carbonate and bicarbonate not measured and other unknown anions
Correlation Analysis Statistical Significant Correlation (n = 17 summer; n = 18 winter)
Science… Winter Analysis Comparison of NH4+ and SO42- ion with stoichiomertic ratio of (NH4)2SO4. (2:1 line reference line represents complete SO42- neutralization). Comparison of excessNH4+ and NO3- ion with stoichiomertic ratio of (NH4)NO3. (The 1:1 line reference line represents complete NO3- neutralization).
NH3 and HNO3 Equilibrium (summer) • [NH3(g)] =27.72 ppb, [HNO3(g)]=2.69 ppb and RH =41.98 %. • RH < RHD (deliquescence) , NH4 NO3 is in solid form • But…. for NH3 (g) + HNO3 (g) ↔ NH4NO3 (p) • [NH3][HNO3] > K of reaction : • [NH3][HNO3] = 74.56ppb2 • K( Calculated) = 306.5 ppb2 • Formation of NH4NO3 will be lower in summer
NH3 and HNO3 Equilibrium( winter) • [NH3(g)] =26.74 ppb;[HNO3(g)]=0.90ppb • RH = 85.35%; RHD (deliquescence)= 68.29% • RH > RHD, NH4NO3 is in aqueous form • NH3 (g) + HNO3 (g) ↔ NH4+ + NO3- T = 290 Kelvin, K = 3.51 ppb2 [NH3(g)] [HNO3(g)]= 24ppb2 > K NH4NO3 Formation favored and in (aq) form US Study (Baek and Aneja, 2004) T= 297 Kelvin, K = 21.59 ppb2 [NH3(g)][HNO3(g)] = 32.2 ppb2> K [NH3] = 78 ppb [HNO3] = 0.41 ppb
Nitrogen Conversion ratio • Nitrogen conversion ratio: Fn = ( PNO3- +GNO3-)/ (NO2+ PNO3- +GNO3- ) PNO3- particulate nitrate as NO2 ,µg/m3 ; GNO3- gaseous nitrate concentration NO2 ,µg/m3 ; NO2 gas phase NO2 concentration, µg/m3 Fn (summer) = 44 % GNO3 >> PNO3 Fn (winter) = 52% PNO3 >> GNO3 Science??
HNO3 and NH3 Seasonal variation NO2 (g) + OH. (g) → HNO3 (g) (1) O3 (g) + hν → O (1D) (g) + O2 (g) (2) O (1D) + H2O (g) → 2 OH. (g) (3) HN03 + hv → NO2 +OH. (4) HNO3 + OH →NO3 +H2O (5) At Equilibrium JHNO3 is the photolytic rate constant for HNO3, and depends on latitude, season and solar zenith angle. It is calculated as the product of actinic flux, quantum yield and absorption cross section area. It is corrected for every season. Concentration of [OH] depends on photolysis rate of O3.
Contd.. • Conclusion: • HNO3 showed seasonal variation, with highest concentration in summer compared to winter and post monsoon. • Photochemical activity and shift of equilibrium from particulate phase ammonium nitrate to gas- phase ammonia and nitric acid. • The equilibrium ratio is highest in summer due to high solar radiation, which leads to higher concentration of OH radical, thereby more formation of HNO3 as determined in Table Pitts and Pitts 1986
Where is all ammonia coming from?Global Atmospheric Sources of Ammonia Sources: http://www.adsa.org/discover/intersummaries/asman.doc
Post Monsoon Winter Summer
Flux Measurement Project – A Unique Opportunity • 3 – M • Multi - Objective • Multi – User • Multi – Parameter • _______________________________________ • Act as Background AQ Stations – Time Series/Trend Analysis • Dispersion/Deposition Studies • Criteria Pollutants • VOCs • WSI – Source Apportionment, Global Warming Model, Atmospheric Chemistry
Acknowledgements…. • We gratefully acknowledge • -- INDO-U.S. SCIENCE AND TECHNOLOGY FORUM • -- DST, New Delhi • -- Prof. Ramesh and Workshop Organizers