Study on Charge Relaxation in Fused Silica Samples under Rotation
150 likes | 255 Vues
Research on relaxation of charge on fused silica samples by contact electrification. Experiment setup, results in vacuum and air, and implications for high-precision detectors like LIGO. Influence of gas pressure on charge relaxation observed.

Study on Charge Relaxation in Fused Silica Samples under Rotation
E N D
Presentation Transcript
Test mass charge relaxation V.P.Mitrofanov, P.E.Khramchenkov, L.G.Prokhorov Moscow State University LIGO/VIRGO LSC Meeting, Baton Rouge, March 2007 G070124-00-Z
Motivation • Livingston event with LIGO ITMY have shown that electrostatic charges are likely create problems even for Initial LIGO. • This motivated us to study relaxation of charge deposited on fused silica sample by contact electrification. Contact electrification is interesting because the test masses touch occasionally viton-tip earthquake stops. • SiO2 is standard material used in silicon technology. There are a lot of papers about electrical properties of SiO2 thin layers but small amount of information about properties of thick samples in vacuum.
Experimental setup(Capacitive probe sensor under rotating sample) Detailed description will be published in Phys. Lett. A
Sensitivity of the probe sensor To study time variations of the charge density at some point on the sample we measured the probe voltages Uiτ when the probe was under this point in the process of the rotation.Standard deviation σU,2τ was calculated for difference Ui+1,τ - Ui,τ between adjacent values. It is plotted as a function of averaging time τ in Fig. Curves were measured: 1 – for immovable sample 2 – for rotating sample in vacuum 3 – for rotating sample in air In air we observed excess noise which was likely associated with charging by dust. In vacuum we have not seen excess noise. Resolution of charge density variation measurement ≈ 5x10³ e/cm2 for τ = 10 sec.
Samples and their preparation ● Fused silica - Russian brand “KV” (content of mineral impurities ~ 50 ppm, hydroxyl groups - ~ 400 ppm) was used. One can expect smaller conductivity for more pure fused silica used in LIGO due to smaller content of impurities. ● Fused silica samples had a mushroom shape (disk diameter - 60 mm, thickness -12 mm with machine polished bottom surface) to decrease effect of the collet clamp. ● Cleaning of the sample was made in ultrasound bath with acetone and with methanol. Then the sample was baked in oven in air at 300° C for 3 hoursto exclude electrical conductivity due to surface contaminations.
Charging of sample by contact electrification(1) • In different models of contact electrification with contact area Atransferred charge q is associated with difference of effective work functions of two materials : q = K A {F(1 - 2)} In the simplest case {F(1 - 2)} is a linear function. Work function depends on the surface condition, deformation, charge located on the surface of dielectric. The proportionality factor K also depends on large number of parameters. ● So contact electrification has poor reproducibility • Repeated contact electrification Number of contacts results in accumulation of charge. NiCr – SiO2 q N
Charging of sample by contact electrification (2) • Examples of the average value of the charge <q>transferred to the fused silica sample after touching (contact area is much less than the probe diameter)
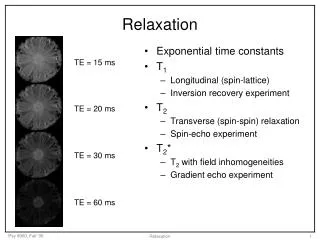
Relaxation of the deposited charge in air (1) • Local deposition of charge resulted in a peak on the time dependence of output voltage repeated with rotation period. • Relaxation of charge manifested itself in the decrease of the peak height and the small increase of the peak width. • Usually decay is not exponential. Relaxation time t* is used as an estimate.
Relaxation of the deposited charge in air(2) • In air, decay of the deposited charge depends on humidity of the ambient air and the sample “history”. The observed relaxation time was from ~ 0.5 hour to 10hours (without the preliminary baking of the sample). The decay is a result of surface conductivity associated with proton H+ transport in water adsorbed on fused silica. Charge flows to the ground via contact of fused silica with metal collet which clamps up the sample.
Relaxation of the deposited charge in vacuum ●Results of charge decay measurements carried out in vacuum for different values of deposited charges of both signs (from about 10 6eto 108e) are presented in Fig. In vacuum no relaxation of deposited charges has been found within the limits of the measurement errors which were about 2%. The relaxation time may be estimated as longer than 8000 hours assuming that the deposited charge decayed exponentially to the value close to zero.
Does the charge relax at low pressure? • There is the third state of the chamber: low pressure in process of pumping out and venting. • In gas, breakdown voltage has minimum for some value of product pd, where p is the pressure and d is the distance between electrodes (Paschen’s law). Mechanism: cascading of secondary electrons emitted as a result of gas molecules collisions. Minimum sparking potential for plane electrodes: Air – 330 V, Ar – 150 V, Ar + 1%Ne - < 150V (Penning’s effect). In our case: Potential of point charge q = 108e located on the sample surface at distance of 1 mm ≈ 600 V.
Reduction of the charge in process of the chamber venting • If relatively large charge was deposited in vacuum by local touching this charge decreased rapidly at some moment of time after a start of the chamber venting (when pressure was ~ 0.1 Torr). Fig.1 Charge distribution before venting (black curve) Charge distribution after venting (blue curve) Fig.2 Reduction of the peak voltage after venting
Some features of the charge relaxation in process of the chamber venting ● Usually charge deposited in air did not decreased in the process of the chamber pumping and venting (in contrast to charge deposited in vacuum). Probably, it happened due to the charge spreading because of the surface conductivity in air which decreased the nonuniform electric field. (Spatial resolution of the probe ~ 4 mm did not allowed us to investigate the effect) ● In case of the point touching by nichrome wire or by fused silica tip reduction of charge could be close to ~100%. In case of viton tip it was ~ (10 – 15) %. Probably, it happened because the touching by nichrome or by fused silica tip deposited negative charge on fused silica sample, by viton – positive charge (the breakdown is triggering by electrons) The effect needs more detailed investigation
Residual charge distribution on fused silica sample • The important question is: What residual charge stays on the sample after discharging and how it fluctuates? Typical charge distribution on our sample after relaxation in air is shown in Fig. Maximum difference in charge density along the scanning strip ≈ 5x10⁵e/cm2. In particular, the distribution was formed by electrical fields inside the vacuum chamber associated with contact potential difference between materials.
Conclusion • Contact of the test mass with earthquake stop tips may build up fairly large electrostatic charge on it. • In vacuum this charge relaxes extremely slowly. • In atmospheric air inside the chamber the charge relaxation time is about several hours due to the surface conductivity of fused silica associated with adsorbed water. Effect of the fast decrease of the charge in the process of the chamber venting may also take place. ● In any case monitoring of charge located on the test mass is reasonable. Passive immovable capacitive probes can be installed near the test mass (all active components of the sensor are outside the vacuum chamber)so that the probe generates ac voltage when the charged test mass is freely swinging. • In Adv. LIGO situation will be more complicated because silica fiber does not allow the charge to flow away and charge fluctuations may create excess noise.