Linear Discriminant Analysis and Logistic Regression
Linear Discriminant Analysis and Logistic Regression. Background. Linear Discriminant Analysis predicts a categorical variable based on one or more metric independent variables. Example.

Linear Discriminant Analysis and Logistic Regression
E N D
Presentation Transcript
Background • Linear Discriminant Analysis predicts a categorical variable based on one or more metric independent variables
Example Consider purchase data compared to a person’s age. A 0 value for Purchase represents someone who didn’t buy, while a 1 represents someone who did. Data Purchase Age
Graph Interpretation Potential customers who did purchase Purchase Potential customers who did not purchase Age
Graphical Representation A discriminant analysis fits a linear regression to this data as though the categorical variable was numerical. Purchase Age
Graphical Representation ctd. Then the Discriminant Analysis determines a cutoff score. For a single predictor variable, this score is where the regression line is equal to.5. Any data points to the left of the line are predicted to be 0, while those to the right are predicted to be 1. For this data, any potential customer below the age of 41 is predicted not to buy, while anyone older is predicted to buy. Purchase Age
A 100% Accurate Discriminate Analysis Even a discriminant analysis that provides perfect separation between purchasers and non-purchasers does not have a perfect R . 2
Classification Accuracy This distance will lower the total R , even though it is a correct classification. 2 Standard Error measures the distance of the predicted value (the regression line) from the observed values. Even data points that are correctly predicted will contribute to the error calculation. Classification accuracy is a better measure.
StatTools – Interpreting Output Predicted Values Actual values Correct Predictions
StatTools – Interpreting Output ctd. False Positives Predicted Values Actual values False Negatives Overall Accuracy
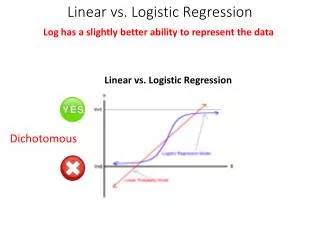
Logistic Regression A logistic regression fits a sigmoid, or S-shaped curve instead of a straight line. On some datasets, this will provide greater classification accuracy.
StatTools – Interpreting Output Age is highly statistically significant Overall Accuracy
Discriminant Analysis Can be used for dependent variables with more than 2 possible values Logistic Regression Less reliant on basic assumptions of the data like normality and constant variance More accurate on borderline points for some datasets Comparison