Download
1 / 37
390 likes | 641 Vues
Practicalities of Radio Interferometry. Rick Perley , NRAO/Socorro. Topics. Topics: Practical Extensions to the Theory: Finite bandwidth Rotating reference frames (source motion) Finite time averaging Local Oscillators and Frequency Downconversion Coordinate systems Direction cosines

E N D
Practicalities of Radio Interferometry Rick Perley, NRAO/Socorro
Topics • Topics: • Practical Extensions to the Theory: • Finite bandwidth • Rotating reference frames (source motion) • Finite time averaging • Local Oscillators and Frequency Downconversion • Coordinate systems • Direction cosines • 2-D (‘planar’) interferometers • 3-D (‘volume’) interferometers • U-V Coverage and synthesized beams. Twelfth Synthesis Imaging Workshop
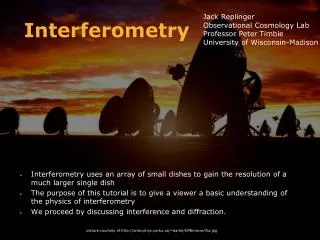
Introduction • In the previous lecture, I set down the principles of Fourier synthesis imaging. • The model used for that was idealistic – not met in practice: • Monochromatic • ‘RF’ signal throughout • Stationary source and reference frame. • We now relax, in turn, these restrictions.
The Effect of Bandwidth. • Real interferometers must accept a range of frequencies. So we now consider the response of our interferometer over frequency. • Define the frequency response functions, G(n), as the amplitude and phase variation of the signal over frequency. • The function G(n) is primarily due to the gain and phase characteristics of the electronics, but can also contain propagation path effects. Dn G n n0
The Effect of Bandwidth. • To find the finite-bandwidth response, we integrate our fundamental response over a frequency width Dn, centered at n0: • If the source intensity does not vary over the bandwidth, and the instrumental gain parameters G are square and real, then where the fringe attenuation function, sinc(x), is defined as: 2008 ATNF Synthesis Imaging School
The Bandwidth/FOV limit • This shows that the source emission is attenuated by the spatially variant function sinc(x), (also known as the ‘fringe-washing’ function). • The attenuation is small when: which occurs when the source offset q is less than: (exercise for the student) • The ration0/Dnis the inverse fractional bandwidth – for the EVLA, this ratio is never less than ~500. • The fringe attenuation is total (zero response) when x=1, or: Independent of frequency!!! 2008 ATNF Synthesis Imaging School
Bandwidth Effect Example • For a square bandpass, the bandwidth attenuation reaches a null at an angle equal to the fringe separation divided by the fractional bandwidth: Dn/n0. • For the old VLA, and its 50 MHz bandwidth, the null was ~1.3 degrees away. • For the EVLA,Dn = 2 MHz, and B = 35 km, then the null occurs at about 27 degrees off the meridian. Fringe Attenuation function: Note: The fringe-attenuation function depends only on bandwidth and baseline – not on frequency. 2008 ATNF Synthesis Imaging School
Observations off the Meridian • In our basic scenario -- stationary source, stationary interferometer -- the effect of finite bandwidth can strongly attenuate the visibility from sources far from the meridional plane. • Since each baseline has its own plane, the only point on the sky free of attenuation is a small angle around the zenith. • Suppose we wish to observe an object far from that plane? • One solution is to use a very narrow bandwidth – this loses sensitivity, which can only be made up by utilizing many channels – feasible, but computationally expensive. • Better answer: Shift the fringe-attenuation function to the center of the source of interest. • How? By adding time delay.
Adding Time Delay s0 s0 s s S0 = reference (delay) direction S = general direction t0 tg b A sensor X t0 The entire fringe pattern has been shifted over by angle sin q = ct0/b
Illustrating Delay Tracking • Top Panel: Delay has been added and subtracted to move the delay pattern to the source location. • Bottom Panel: A cosinusoidal sensor pattern is added, to illustrate losses from a fixed sensor.
Observations from a Rotating Platform • Real interferometers are built on the surface of the earth – a rotating platform. From the observer’s perspective, sources move across the sky. • Since we know how to adjust the interferometer to move its coherence pattern to the direction of interest, it is a simple step to continuously move the pattern to follow a moving source. • All that is necessary is to continuously slip the inserted time delay, with an accuracy dt << 1/Dn to minimize bandwidth loss. • For the ‘radio-frequency’ interferometer we are discussing here, this will automatically track both the fringe pattern and the fringe-washing function with the source. • Hence, a point source, at the reference position, will give uniform amplitude and zero phase throughout time (provided real-life things like the atmosphere, ionosphere, or geometry errors don’t mess things up … )
Time Averaging Loss • So – we can track a moving source, continuously adjusting the delay to prevent bandwidth losses. • This also ‘moves’ the cosinusoidal fringe pattern – very convenient! • From this, you might think that you can increase the time averaging for as long as you please. • But you can’t – because the convenient tracking only works perfectly for the object ‘in the center’. • All other sources are moving w.r.t. the fringes … Twelfth Synthesis Imaging Workshop
Time-Smearing Loss Timescale • Turquoise area is antenna primary beam on the sky – radius = l/D • Interferometer coherence pattern has spacing = l/B • Sources in sky rotate about NCP at angular rate: • we =7.3x10⁻⁵rad/sec. • Minimum time taken for a source to move by l/B at angular distance qis: • This is 10 seconds for a 35-kilometer baseline and a Simple derivation of fringe period, from observation at the NCP. Source we q SCP l/D Primary Beam Half Power Interferometer Fringe Separation l/B For sources at the half power distance 2008 ATNF Synthesis Imaging School
Time-Averaging Loss • In our scenario moving sources and a ‘radio frequency’ interferometer, adding time delay to eliminate bandwidth losses also moves the fringe pattern. • A major advantage of ‘tracking’ the target source is that the rate of change of visibility phase is greatly decreased – allowing us to integrate longer, and hence reduce database size. • How long can you integrate before the differential motion shifts the source through the fringe pattern? • Worst case: (whole hemisphere): • t = l/(Bwe) sec = 83 msec at 21 cm. • Worst case for a 25-meter antenna and 35-km baseline: • t = D/(Bwe) = 10 seconds. • To prevent ‘delay losses’, your averaging time must be much less than this. 2008 ATNF Synthesis Imaging School
The Heterodyne Interferometer: LOs, IFs, and Downcoversion • This would be the end of the story (so far as the fundamentals are concerned) if all the internal electronics of an interferometer would work at the observing frequency (often called the ‘radio frequency’, or RF). • Unfortunately, this cannot be done in general, as high frequency components are much more expensive, and generally perform more poorly than low frequency components. • Thus, most radio interferometers use ‘down-conversion’ to translate the radio frequency information from the ‘RF’, to a lower frequency band, called the ‘IF’ in the jargon of our trade. • For signals in the radio-frequency part of the spectrum, this can be done with almost no loss of information. • But there is an important side-effect from this operation in interferometry which we now review.
Downconversion At radio frequencies, the spectral content within a passband can be shifted – with almost no loss in information, to a lower frequency through multiplication by a ‘LO’ signal. Sensor LO Filtered IF Out IF Out RF In Filter X P(n) P(n) P(n) n nLO n n Lower Sideband Only Original Spectrum Lower and Upper Sidebands, plus LO This operation preserves the amplitude and phase relations.
Signal Relations, with LO Downconversion • The RF signals are multiplied by a pure sinusoid, at frequency nLO • We can add aritrary phase fLO on one side. tg E cos(wRFt) X fLO X wLO Multiplier Local Oscillator Phase Shifter E cos(wIFt-fLO) (wRF=wLO+wIF) t0 Complex Correlator X E cos(wIFt-wIFt0-fLO) E cos(wIFt-wRFtg) Not the same phase as the RF interferometer!
Recovering the Correct Visibility Phase • The correct phase (RF interferometer) is: • The observed phase (with frequency downconversion) is: • These will be the same when the LO phase is set to: • This is necessary because the delay,t0, has been added in the IF portion of the signal path, rather than at the frequency at which the delay actually occurs. • The phase adjustment of the LO compensates for the delay having been inserted at the IF , rather than at the RF. 2008 ATNF Synthesis Imaging School
A Side Benefit of Downconversion • The downconversion interferometer allows us to independently track the interferometer phase, separate from the delay compensation. • Note there are now three ‘centers’ in interferometry: • Sensor (antenna) pointing center • Delay (coherence) center • Phase tracking center. • All of these which are normally at the same place – but are not necessarily so.
Geometry – 2-D and 3-D Representations To give better understanding, we now specify the geometry. Case A: A 2-dimensional measurement plane. • Let us imagine the measurements of Vn(b) to be taken entirely on a plane. • Then a considerable simplification occurs if we arrange the coordinate system so one axis is normal to this plane. • Let (u,v,w) be the coordinate axes, with w normal to this plane. Then: u, v, and w are always measured in wavelengths. • The components of the unit direction vector, s, are:
Direction Cosines w s The unit direction vectorsis defined by its projections (l,m,n) on the (u,v,w) axes. These components are called the Direction Cosines. n q b a l v m The baseline vectorb is specified by its coordinates (u,v,w) (measured in wavelengths). In this special case, w = 0, and b u
The 2-d Fourier Transform Relation Then,nb.s/c = ul + vm + wn = ul + vm, from which we find, which is a 2-dimensional Fourier transformbetween the projected brightness and the spatial coherence function (visibility): And we can now rely on a century of effort by mathematicians on how to invert this equation, and how much information we need to obtain an image of sufficient quality. Formally, With enough measures of V, we can derive an estimate of I.
Interferometers with 2-d Geometry • Which interferometers can use this special geometry? a) Those whose baselines, over time, lie on a plane (any plane). All E-W interferometers are in this group. For these, the w-coordinate points to the NCP. • WSRT (Westerbork Synthesis Radio Telescope) • ATCA(Australia Telescope Compact Array) • Cambridge 5km telescope (almost). b) Any coplanar 2-dimensional array, at a single instance of time. • VLA or GMRTin snapshot (single short observation) mode. • What's the ‘downside’ of 2-d arrays? • Full resolution is obtained only for observations that are in the w-direction. • E-W interferometers have no N-S resolution for observations at the celestial equator. • A VLA snapshot of a source will have no ‘vertical’ resolution for objects on the horizon.
3-d Interferometers Case B: A 3-dimensional measurement volume: • What if the interferometer does not measure the coherence function on a plane, but rather does it through a volume? In this case, we adopt a different coordinate system. First we write out the full expression: (Note that this is not a 3-D Fourier Transform). • We orient the w-axis of the coordinate system to point to the region of interest. The u-axis point east, and the v-axis to the north. • We introduce phase tracking, so the fringes are ‘stopped’ for the direction l=n=0. • Then, remembering that
General Coordinate System • This is the coordinate system in most general use for synthesis imaging. • w points to the source, u towards the east, and v towards the north. The direction cosines l and m then increase to the east and north, respectively. = ‘Projected Baseline’ w s0 s0 b v
3-d to 2-d • The expression is still not a proper Fourier transform. We can get a 2-d FT if the third term in the phase factor is sufficient small. • The third term in the phase can be neglected if it is much less than unity: • This condition holds when: (angles in radians!) • If this condition is met, then the relation between the Intensity and the Visibility again becomes a 2-dimensional Fourier transform:
The Problem with Non-coplanar Baselines • Use of the 2-D transform for non-coplanar interferometer arrays (like the VLA) always result in an error in the images. • Formally, a 3-D transform can be constructed to handle this problem – see the textbook for the details. • The errors increase inversely with array resolution, and quadratically with image field of view. • For interferometers whose field-of-view is limited by the primary beam, low-frequencies are the most affected. • Then, • Or, if you’ve got trouble! Twelfth Synthesis Imaging Workshop
Coverage of the U-V Plane • Obtaining a good image of a source requires adequate ‘coverage’ of the (u,v) plane. • To describe the (u,v) coverage, adopt an earth-based coordinate grid to describe the antenna positions: • X points to H=0, d=0 (intersection of meridian and celestial equator) • Y points to H = -6, d = 0 (to east, on celestial equator) • Z points to d = 90 (to NCP). • Then denote by (Bx, By, Bz) the coordinates, measured in wavelengths, of a baseline in this earth-based frame. • (Bx, By) are the projected coordinates of the baseline (in wavelengths) on the equatorial plane of the earth. • By is the East-West component • Bz is the baseline component up the Earth’s rotational axis.
(U,V) Coordinates • Then, it can be shown that • The u and v coordinates describe E-W and N-S components of the projected interferometer baseline. • The w coordinate is the delay distance in wavelengths between the two antennas. The geometric delay, tgis given by • Its derivative, called the fringe frequencynFis 2008 ATNF Synthesis Imaging School
Fringe Frequencies, etc. • The quantitity is critical in interferometry. • It is a measure of the rate at which a celestial source crosses the interferometer coherence pattern. • At either pole, the fringe frequency is zero. (no surprise!) • Its maximum rate is on the celestial equator: Hz (Remember that u = baseline in wavelengths, wE = 7.27x10⁻⁵rad sec-1) • A 1-million wavelength baseline then has a maximum fringe frequency of 72.7 Hz. • An important related quantity is the Delay Rate – the rate at which delay must be added to compensate for this motion (‘stop the fringes’): • This rate is 0.24 BXcosdnsec/sec, with BX in Km. 2010 NRAO Synthesis Imaging School
E-W Array Coverage and Beams • The simplest case is for E-W arrays, which give coplanar coverage. • Consider a ‘minimum redundancy array’, with eight antennas located at • 0, 1, 2, 11, 15, 18, 21 and 23 km along an E-W arm. • o ooooooo • Of the 28 simultaneous spacings, 23 are of a unique separation. • The U-V coverage (over 12 hours) at d = 90, and the synthesized beam are shown below, for a wavelength of 1m. 2010 NRAO Synthesis Imaging School
E-W Arrays and Low-Dec sources. • But the trouble with E-W arrays is that they are not suited for low-declination observing. • At d=0, coverage degenerates to a line. d=10 d=30 d=60 2010 NRAO Synthesis Imaging School
Baseline Locus • Each baseline, over 24 hours, traces out an ellipse in the (u,v) plane: • Because brightness is real, each observation provides us a second point, where: V(-u,-v) = V*(u,v) • E-W baselines of no ‘v’ offset in the ellipses. A single Visibility: V(u,v) V Good UV Coverage requires many simultaneous baselines amongst many antennas, or many sequential baselines from a few antennas. U Its Complex Conjugate V(-u,-v) 2008 ATNF Synthesis Imaging School
Getting Good Coverage near d = 0 • The only means of getting good 2-d angular resolution at all declinations is to build an array with N-S spacings. • Many more antennas are needed to provide good coverage for such geometries. • The VLA was designed to do this, using 9 antennas on each of three equiangular arms. • Built in the 1970s, commissioned in 1980, and undergoing a major upgrade now, the VLA vastly improved radio synthesis imaging at all declinations. • Each of the 351 spacings traces an elliptical locus on the (u,v) plane. • Every baseline has some (N-S) component, so none of the ellipses is centered on the origin. 2010 NRAO Synthesis Imaging School
Sample VLA (U,V) plots for 3C147 (d = 50) • Snapshot (u,v) coverage for HA = -2, 0, +2 (with 26 antennas). HA = 0h HA = -2h HA = 2h Coverage over all four hours.
VLA Coverage and Beams d=90 d=60 d=30 d=0 d=-30 Twelfth Synthesis Imaging Workshop
UV Coverage and Imaging Fidelity • Although the VLA represented a huge advance over what came before, its UV coverage (and imaging fidelity) is far from optimal. • The high density of samplings along the arms (the 6-armed star in snapshot coverage) results in ‘rays’ in the images due to small errors. • A better design is to ‘randomize’ the location of antennas within the span of the array, to better distribute the errors. • Of course, more antennas are a good idea. • The VLA’s wye design was dictated by its 220 ton antennas, and the need to move them. Railway tracks are the only answer. • Future major arrays (should we get to build them) will utilize smaller, lighter elements which must not be positioned with any regularity. Twelfth Synthesis Imaging Workshop