Canadian Geography 1202
This unit explores the complexities of human population issues in Canada, highlighting the diverse demographics and the factors that influence population change. With a population of 33.5 million, Canada represents less than 1% of the world's population. We delve into the concepts of natural change (births minus deaths) and actual change (natural change plus migration). Key aspects such as population density, distribution, and the significance of population pyramids provide insights into planning for future societal needs like schools, hospitals, and workforce requirements.

Canadian Geography 1202
E N D
Presentation Transcript
Canadian Geography 1202 Unit 2: Human Population Issues in Canadian Geography
Canadian Geography 1202 3.0 Demographic Patterns and Trends in Canada
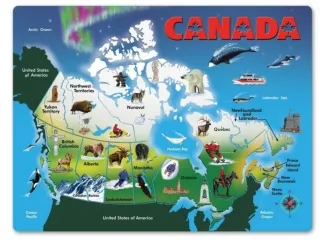
Canada’s Population Population: The measure of the number of people living in a specific place Canada’s population is 33.5 million people This is less than 1% of total world population Canada’s population is known for its diversity Diversity: A variety of different things The people that make up the Canada come from all over the world
Demography Demography– the numerical study of the characteristics, trends, and issues of population. We will examine: Population Change Population Dynamics Population Trends
Demography We study demography to determine the needs of Canadian society How many schools will we need? How many hospitals do we need? Where should we put an old age home? We study demography to help us plan for the future needs of society Do we need more workers?
Population Change To study population change we look at four factors: 1. Deaths 2. Births 3. Emigration 4. Immigration
Population Change There are two way we measure changes in populations Natural Change Actual Change
Natural Change Natural Change: The change of population due to natural causes. Formula: Natural Change= Births - Deaths Example: Births: 3000 Deaths: 2000 Natural Change = Births – Deaths Natural Change = 3000 – 2000 Natural Change = 1000 The population grew by 1000 people
Immigration Immigration: Moving into a country to live permanently China town in Toronto is a good example of site where you would find a lot of immigrants
Emigration Emigration: Leaving a country to live in another country These are some popular destinations for Canadian emigrants
Actual Change Actual Change: The population change due to natural change and migration Formula: Actual Change = (Births - deaths) + ( Immigration - Emigration) Births = 2000 Deaths = 500 Immigration=1000 Emigration = 1500 Actual Change = (Births - deaths) + ( Immigration - Emigration) Actual Change = ( 2000 - 500) + (1000 - 1500) Actual Change = (1500) + (-500) Actual Change = 1000 The population grew by 1000 people
Birth Rate Birth Rate: the number of children born in an area for every 1000 inhabitants Canada has a birth rate of 11.3 children born for ever 1000 Canadians The Canadian birth rate is the same as most other industrialized countries x 1000 Formula:
Death Rate Death Rate: The number of people in a population that die for every 1000 inhabitants Canada’s death rate is 7.3 deaths for every 1000 people Formula: x 1000
Population Dynamics Density Distribution Migration Population pyramids;
Population Density Population density: A measure of how crowded a place is. Formula: Overall Canada has a low population density of about 3 people per However this is misleading because most of Canada’s population is located in Cities along the boarder
Talking about Density Densely Populated: Large number of people per land mass (>100) Moderately Populated: Medium number of people per land mass (10-100) Sparsely Populated: low number of people per land mass (0-10)
Problem!!! Sometimes population density does not allow you to describe a population in useful ways Look at these moose populations. They all have a density of five moose per square kilometer but they are arranged in very different ways. How can we describe them??? We will describe them by their distribution!
Population Distribution Lets look at this population first: It is all grouped in the lower corner of the area. We can say it is concentrated Concentrated: Population is grouped into a small part of an area
Population Distribution Now lets look at this population We can see that it is spread out evenly over the entire area. We can say that is dispersed Dispersed: Population is spread out over an area
Lastly we will talk about this one: Population Distribution Well it is not concentrated… and its not completely dispersed…… so how do we describe it??? We would say that this moose population is somewhat concentrated We will have to look at it to see which it better represents! Concentrated? Dispersed?
Now lets look at Canada How would you describe the population density? Lets look at it like this: How many of major cities in Canada are within 250 km of the U.S. boarder? We could say that the Canadian population is mostly concentrated near the United States boarder.
Population Pyramids Population Pyramid: A graph that shows population by age group Population pyramids are actually two bar graphs joined together They show males on one side and females on the other.
Population Pyramids There are three general types: Expanding Stable Contracting
Population Pyramids Expanding: Showing growing populations Expanding pyramids can be broken down to include rapidly, and steady expanding Expanding pyramids have wide bases They show lots of children, suggesting a high birth rate They also show a low life expectancy
Population Pyramids Stationary: These pyramids show a stable population, there is very little growth. Birth rates decline but life expectancy increases These are common in developed countries
Population Pyramids Contracting: Population pyramids that represent a population that is shrinking These pyramids are narrow at the bottom. The population is older on average, with a long life expectancy but also a low birth rate Common in very developed countries, with High education levels and access to birth control and few negative environmental factors.
Canada’s Population Pyramid Video The population pyramid for Canada can be classified as stationary. There is an anomaly in the bump that can be seen in the population aged 30-40 These are the children of the baby boom Other than this bump all evidence points toward a stationary population pyramid It is rectangular in shape leading up from the base with a peak at the top.
Migration Push Factor: Conditions or situations that will cause a person to leave their home country War Political Instability Unemployment Poor Living Conditions Poor Economic Conditions Pull Factor: Conditions or situations that will cause a person to settle in one country or another Peaceful Society Employment Opportunities Climate Good Living Conditions Attractive Culture
Migration in Canada Migration happens within Canada, between the provinces Each province has different push and pull factors Over time these factors change causing different trends to be seen. Out-migration: When people leave a province or territory In-migration: When people move to line in a new province or territory
Population Trends There are five Trends in Canada’s population that we will study in this course: • aging population; • declining birth rate; • shortages in workers in particular sectors of the economy; • arrival of refugees; and • population distribution. In this section we will focus on analyzing data to identify some of these trends
Population Trends: Aging Population Aging Population: A population where the median age is rising. Median is the middle number in an ordered data set 1 , 5 , 5 , 7 , 8 , 10, 12, 14, 16, 22, 35 The Canadian population is aging. In 2011, the median age in Canada was 39.9 years, meaning that half of the population was older than that and half was younger. In 1971, the median age was 26.2 years
Population Trends: Aging Population As the population of senior citizens increases the mean age of the Canadian population will Increase unless there is a influx of young people By 2061 it is predicted that 25.5% will be over 65 years old This will cause a great deal of stress for todays systems
Population Trends: Aging Population Canada’s aging population is highly regionalized You can see this by looking at the population over age 65 in each province The populations with the highest percentage of over 65 people are in NL, PEI, NS, and NB All Atlantic Provinces!!!!!
Population Trends: Declining Birth Rate Birth rate refers to the amount of children born per 1000 people in a population If you look at individual averages the replacement rate is 2.1 children per woman Replacement Rate: The number at which a population will remain stable, will not go up or down.
Population Trends: Declining Birth Rate Since the 1970’s Canada has had a birth rate lower than the replacement rate Higher education, a change in societal norms, and access to birth control have all combined to produce this decrease in birth rate When there are fewer people being born it causes stress on social systems as there will be nobody to pay for services in the future. Lower birth rates reduce the actual change, and lower growth rates To keep the country running The government needs to recruit people from other areas of the world
Note: From 1867 to 1901, the population count that was used to calculate population growth was that of April 1. From 1902 to 1970, the population count was that of June 1. From 1971 to present, the population count was that of July 1. The population of Newfoundland and Labrador is excluded before 1949
Worker Shortage Canada has a shortage of skilled workers. Skilled Worker: A worker who is trained to do a particular job that would not be able to be Completed by someone without this training. Mining, Business, and Health industries are all facing serious skilled worker shortages The province with the greatest shortage is Alberta Worker shortages stall economic growth
Population Distribution Most of Canada’s population is concentrated in major urban areas This creates islands of population in a vast sea of unpopulated areas
Population Distribution Most of Canada’s population is concentrated in four provinces Ontario has by far the largest percentage with almost 40% of all Canadians living there
Population Distribution An urban area is defined as an area with a population of at least 1,000 and with no fewer than 400 persons per square kilometre Urbanization: The building up of populations in cities or urban areas The portion of the population in Canada that lives in urban areas is increasing
Population Distribution Urban population varies depending on province The provinces with the highest percentage living in urban areas are ON, BC, AB, QC
Note: The 1867 figure applies to April 1 of that year. From 1902 to 1970, the
Canada’s Diversity There were 5.6 million foreign born in Canada in 2001, representing 19 percent of the total population The majority (41 percent) of all immigrants in Canada are from Europe Over one-third of all immigrants in Canada are from Asia Compared to the United states Canada has a higher percentage of Immigrants from Africa