Download
1 / 6
60 likes | 82 Vues
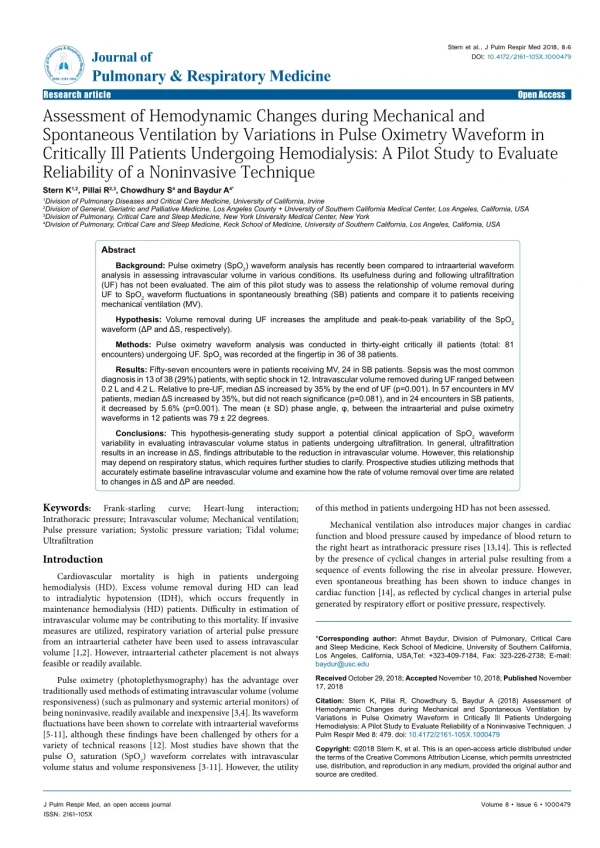
Pulse oximetry (SpO2) waveform analysis has recently been compared to intraarterial waveform analysis in assessing intravascular volume in various conditions. Its usefulness during and following ultrafiltration (UF) has not been evaluated. The aim of this pilot study was to assess the relationship of volume removal during UF to SpO2 waveform fluctuations in spontaneously breathing (SB) patients and compare it to patients receiving mechanical ventilation (MV).

E N D
Stern et al., J Pulm Respir Med 2018, 8:6 DOI: 10.4172/2161-105X.1000479 JournalofPulmonary&RespiratoryMedicine ISSN: 2161-105X Journal of Pulmonary & Respiratory Medicine Research article Assessment of Hemodynamic Changes during Mechanical and Spontaneous Ventilation by Variations in Pulse Oximetry Waveform in Critically Ill Patients Undergoing Hemodialysis: A Pilot Study to Evaluate Reliability of a Noninvasive Technique Stern K1,2, Pillai R2,3, Chowdhury S4 and Baydur A4* Open Access 1Division of Pulmonary Diseases and Critical Care Medicine, University of California, Irvine 2Division of General, Geriatric and Palliative Medicine, Los Angeles County + University of Southern California Medical Center, Los Angeles, California, USA 3Division of Pulmonary, Critical Care and Sleep Medicine, New York University Medical Center, New York 4Division of Pulmonary, Critical Care and Sleep Medicine, Keck School of Medicine, University of Southern California, Los Angeles, California, USA Abstract Background: Pulse oximetry (SpO2) waveform analysis has recently been compared to intraarterial waveform analysis in assessing intravascular volume in various conditions. Its usefulness during and following ultrafiltration (UF) has not been evaluated. The aim of this pilot study was to assess the relationship of volume removal during UF to SpO2 waveform fluctuations in spontaneously breathing (SB) patients and compare it to patients receiving mechanical ventilation (MV). Hypothesis: Volume removal during UF increases the amplitude and peak-to-peak variability of the SpO2 waveform (ΔP and ΔS, respectively). Methods: Pulse oximetry waveform analysis was conducted in thirty-eight critically ill patients (total: 81 encounters) undergoing UF. SpO2 was recorded at the fingertip in 36 of 38 patients. Results: Fifty-seven encounters were in patients receiving MV, 24 in SB patients. Sepsis was the most common diagnosis in 13 of 38 (29%) patients, with septic shock in 12. Intravascular volume removed during UF ranged between 0.2 L and 4.2 L. Relative to pre-UF, median ΔS increased by 35% by the end of UF (p=0.001). In 57 encounters in MV patients, median ΔS increased by 35%, but did not reach significance (p=0.081), and in 24 encounters in SB patients, it decreased by 5.6% (p=0.001). The mean (± SD) phase angle, φ, between the intraarterial and pulse oximetry waveforms in 12 patients was 79 ± 22 degrees. Conclusions: This hypothesis-generating study support a potential clinical application of SpO2 waveform variability in evaluating intravascular volume status in patients undergoing ultrafiltration. In general, ultrafiltration results in an increase in ΔS, findings attributable to the reduction in intravascular volume. However, this relationship may depend on respiratory status, which requires further studies to clarify. Prospective studies utilizing methods that accurately estimate baseline intravascular volume and examine how the rate of volume removal over time are related to changes in ΔS and ΔP are needed. Keywords: Intrathoracic pressure; Intravascular volume; Mechanical ventilation; Pulse pressure variation; Systolic pressure variation; Tidal volume; Ultrafiltration Introduction Cardiovascular mortality is high in patients undergoing hemodialysis (HD). Excess volume removal during HD can lead to intradialytic hypotension (IDH), which occurs frequently in maintenance hemodialysis (HD) patients. Difficulty in estimation of intravascular volume may be contributing to this mortality. If invasive measures are utilized, respiratory variation of arterial pulse pressure from an intraarterial catheter have been used to assess intravascular volume [1,2]. However, intraarterial catheter placement is not always feasible or readily available. Pulse oximetry (photoplethysmography) has the advantage over traditionally used methods of estimating intravascular volume (volume responsiveness) (such as pulmonary and systemic arterial monitors) of being noninvasive, readily available and inexpensive [3,4]. Its waveform fluctuations have been shown to correlate with intraarterial waveforms [5-11], although these findings have been challenged by others for a variety of technical reasons [12]. Most studies have shown that the pulse O2 saturation (SpO2) waveform correlates with intravascular volume status and volume responsiveness [3-11]. However, the utility of this method in patients undergoing HD has not been assessed. Frank-starling curve; Heart-lung interaction; Mechanical ventilation also introduces major changes in cardiac function and blood pressure caused by impedance of blood return to the right heart as intrathoracic pressure rises [13,14]. This is reflected by the presence of cyclical changes in arterial pulse resulting from a sequence of events following the rise in alveolar pressure. However, even spontaneous breathing has been shown to induce changes in cardiac function [14], as reflected by cyclical changes in arterial pulse generated by respiratory effort or positive pressure, respectively. *Corresponding author: Ahmet Baydur, Division of Pulmonary, Critical Care and Sleep Medicine, Keck School of Medicine, University of Southern California, Los Angeles, California, USA,Tel: +323-409-7184, Fax: 323-226-2738; E-mail: baydur@usc.edu ReceivedOctober 29, 2018; AcceptedNovember 10, 2018; Published November 17, 2018 Citation:Stern K, Pillai R, Chowdhury S, Baydur A (2018) Assessment of Hemodynamic Changes during Mechanical and Spontaneous Ventilation by Variations in Pulse Oximetry Waveform in Critically Ill Patients Undergoing Hemodialysis: A Pilot Study to Evaluate Reliability of a Noninvasive Techniquen. J Pulm Respir Med 8: 479. doi: 10.4172/2161-105X.1000479 Copyright: ©2018 Stern K, et al. This is an open-access article distributed under the terms of the Creative Commons Attribution License, which permits unrestricted use, distribution, and reproduction in any medium, provided the original author and source are credited. J Pulm Respir Med, an open access journal ISSN: 2161-105X Volume 8 • Issue 6 • 1000479
Citation: Stern K, Pillai R, Chowdhury S, Baydur A (2018) Assessment of Hemodynamic Changes during Mechanical and Spontaneous Ventilation by Variations in Pulse Oximetry Waveform in Critically Ill Patients Undergoing Hemodialysis: A Pilot Study to Evaluate Reliability of a Noninvasive Techniquen. J Pulm Respir Med 8: 479. doi: 10.4172/2161-105X.1000479 Page 2 of 6 The aim of this pilot study was to assess how mechanical ventilation (MV) affects SpO2 waveform fluctuations as compared with spontaneously breathing (SB) in patients undergoing ultrafiltration (UF) during intermittent hemodialysis. Specifically, we wished to assess the relationship of volume removal during UF to SpO2 waveform variability in spontaneously breathing patients and compare it to those receiving ventilatory support. In a subset of patients, we also assessed the reliability of the SpO2 waveform by computing the phase angle between with SpO2 variation that of intraarterial waveform fluctuations. We hypothesized that volume removal during UF increases the amplitude and peak-to-peak variability of the SpO2 waveform (ΔP and ΔS, respectively). Methods Patients Pulse oximetry waveform analysis was retrospectively conducted in 38 patients aged 18-80 years, admitted to the medical intensive care unit (MICU) receiving hemodialysis (HD). Patients were randomly selected as a sample of convenience- data was collected immediately before and after HD from whoever was receiving HD at the time the investigators were in the intensive care unit. As this was an observational pilot study, the sample size was not predetermined due to difficulty estimating the magnitude of SpO2 waveform variability and due to our time constraints. Data collected included anthropometric features, diagnoses, vital signs, ventilator modes and settings, net volume of fluid removed during HD, and any inotropic and vasopressor agents at the time. Patients were excluded if they were undergoing cardiopulmonary resuscitation, were hypothermic (core temperature < 32ºC [89.6ºF]), or had evidence of mitral or severe tricuspid valve dysfunction confirmed by echocardiography. Pulse oximetry tracings were obtained as part of multichannel physiologic recording (telemetry) and printed out on paper strip for subsequent analysis (IntelliVue X2, Philips, North America Corporation, Andover, MA), just prior to and immediately after undergoing HD. Recordings were made with subjects in semi- recumbent position in the MICU. Either volume- or pressure- controlled ventilation was used. The patients were sedated with fentanyl, midazolam, and/or propofol. Recordings were made only if the quality of the signal was optimal according to the perfusion index displayed on the monitor. Respiratory rate was calculated based on bioimpedance pneumography from the electrocardiogram wires. Tracings were obtained over 5 respiratory cycles. Data analysis Volume removed during HD was recorded every 15 minutes by dedicated HD nursing staff. Volume gained from infused crystalloid solutions and blood products was recorded over the same time as HD was administered. The net volume removed or gained was expressed in mL. Variation in the amplitude (ΔP) of the SpO2 wave was determined as the difference between end-inspiration and end-expiration over five respiratory cycles in SB and MV patients (Figure 1) [15]: ΔP = (ampmax-ampmin)/{(ampmax+ampmin)/2}*100 (eq. 1) The difference in the peak values (ΔS) of the SpO2 waveform at end- inspiration and end-expiration in SB and MV patients was expressed as (Figure 1) [16]: ΔS = (peakmax-peakmin)/{(ampmax+ampmin)/2}*100 (eq.2) The values of ΔP and ΔS were calculated before and after UF. The values of ΔP and ΔS were calculated before and after UF. The relation and/or gained during HD was assessed at each encounter by Pearson correlation. Simultaneous recordings of intraarterial (radial) and SpO2 tracings were obtained in a subset of 12 randomly selected patients. The phase angle, φ, was computed as a measure of the time delay between two periodic signals (that is, of the plethysmographic and intraarterial tracings) expressed as a fraction of the wave period (Figure 2) [17]. The intraarterial and oximetry waveforms were considered to be in phase when the temporal difference between the peaks of the two measurements was <10% of the duration of the pulse wave. In each case, the locations of the SpO2 transducer and arterial line were noted. Because of reports of poor concordance between pulse pressure and pulse oximetry as a means of assessing volume responsiveness [12], we also assessed in a subset of 10 randomly selected encounters from a prior study reported in abstract form [18], the effect of increasing the number of respiratory cycles analyzed from five to thirty on the coefficient of variation for ΔP and ΔS. Statistical analysis Values were expressed as median and interquartile range. Differences between MV and SB cohorts were analyzed by analysis of variance (ANOVA) [19]. Because of non-normal distribution of data, the effects of MV and SB on ΔP and ΔS with measurements ranging from 5 to 30 respiratory cycles were compared using the Wilcoxon rank sum test. Figure 1: Pulse O2 saturation (SpO2) measurements were taken from a mean of 5 respiratory cycles (one set between the red lines). ampmax is the amplitude C-D, ampmin is the amplitude A-B, the (peakmax-peakmin) value is the distance between B and D [inset]; (ABP: arterial blood pressure) [18]. Figure 2: Tracings of intraarterial (top) and pulse oximetry (bottom) waveforms. See text for details of computation of phase angle, φ, between the tracings. J Pulm Respir Med, an open access journal ISSN: 2161-105X Volume 8 • Issue 6 • 1000479
Citation: Stern K, Pillai R, Chowdhury S, Baydur A (2018) Assessment of Hemodynamic Changes during Mechanical and Spontaneous Ventilation by Variations in Pulse Oximetry Waveform in Critically Ill Patients Undergoing Hemodialysis: A Pilot Study to Evaluate Reliability of a Noninvasive Techniquen. J Pulm Respir Med 8: 479. doi: 10.4172/2161-105X.1000479 Page 3 of 6 Associations between ΔP and ΔS before and after UF were assessed by Pearson correlation, in both SB and MV patients. The effects of MV and SB on ΔP and ΔS for 5 through 30 cycles were compared using Wilcoxon rank sum test. A p-value of 0.05 was considered statistically significant. This study was approved by the institutional review board for Los Angeles County and University of Southern California Medical Center, project number HS-15-00423. Results Demographic and clinical data of the 38 patients are summarized in Table 1. Fifty-seven encounters were recorded while patients were receiving MV under sedated conditions for respiratory failure or for airway protection; 24 encounters were recorded during SB under similar conditions. The most common diagnosis upon admission to the MICU was sepsis in 13 (29 %) patients; septic shock (defined as the need for vasopressors) was diagnosed in 12 of the 57 encounters (21%), all of whom received MV (Table 1). Of those 57 encounters with mechanical ventilation, 46 encounters were in volume control mode, 11 were in pressure control mode. Pulse oximetry was recorded at the fingertip, earlobe, forehead, and toe in 36, 2, 0 and 0 patients, respectively. Effect of ultrafiltration on ΔP and ΔS The net volume removed during UF ranged between 0.2 L and 4.2 L. Figure 3a shows the overall effect of UF on ΔS in all patients (81 encounters). As can be seen from the plots the changes were non- parametric in distribution. Figure 3: (a-c) Changes in ΔS before and after ultrafiltration (UF) in all patients (81 encounters), patients receiving mechanical ventilation (MV) (57 encounters) and those breathing spontaneously (SB) (24 encounters). Median ΔS increased by 35% by the end of UF (p=0.001). Figures 3b and 3c show, respectively, that in 57 encounters in MV patients, median ΔS also increased by 35%, but did not reach a statistically significant level (p=0.081), and in 24 encounters in SB patients, it decreased by 5.3% (p=0.001). ΔP did not change significantly with UF in either SB or MV patients. The association between net intravascular volume removed and ΔP and ΔS was weak in all patients [r2=0.0402 (p<0.05), single-tailed], and weak and not statistically significant in MV and SB patients when analysed separately [r2=0.0342 (NS) and r2=0.0566 (p<0.05), all single-tailed, respectively]. We found that the rate of volume removal over time during UF was not associated with a consistent change in ΔP and ΔS, nor did correction for body weight or BMI improve this relationship. Relation of the pulse oximetry waveform to intraarterial waveform Figure 2 shows an example of tracings of SpO2 and intraarterial waveform simultaneously recorded at the fingertip and at the radial artery, respectively. In the 12 patients in which it was measured, the mean heart rate (± SD) was 88 (± 18) beats per minute, and the phase angle, φ, between the intraarterial and pulse oximetry waveforms was 79 ± 22 degrees, indicating that placement of the sensor on the fingertip resulted in the waveforms being out of phase from the radial arterial pulse tracing by 0.15 sec. Variability of ΔP and ΔS depends on the number of respiratory cycles analyzed Figure 4 shows that the coefficient of variation for ΔP and ΔS in a subset of 5 randomly selected patients decreased exponentially as the number of respiratory cycles analyzed increased from 5 to 30. The scatter of data was less for ΔS at each number of respiratory cycles analyzed, both prior to, and after UF. Discussion To our knowledge, this is the first study evaluating respiratory cycle-induced plethysmographic SpO2 amplitude (ΔP) and peak values (ΔS) before and after volume removal by ultrafiltration. We found that withdrawal of volume during ultrafiltration resulted in an increase in the ΔS but not the amplitude (ΔP) of the SpO2 waveform. The increase in ΔS following UF was significant when all patients were considered, but this was not the case when SB and MV patients were analyzed separately. In fact, SB patients showed a small but significant decrease in ΔS. We found no significant relationship with ΔP with any patient population. Finally, we found a marked phase lag between arterial pulse and pulse oximetry waveforms suggesting, at best, a weak association between the 2 monitoring tools in the particular circumstance of ultrafiltration. Volume expansion is administered to septic patients to improve hemodynamics. However, excessive volume expansion leads to lung water accumulation, which may worsen gas exchange, decrease cardiac Spontaneously Breathing Mechanically Ventilated Variables Patients (N) 16 22 Age, median (IQR) 50 (49-60) 50 (40-62) Gender (M/F) 10/6 14/8 Diagnoses Sepsis (n) 2 9 Pneumonia (n) 0 3 Acute Respiratory Distress Syndrome (n) 0 0 Congestive Heart Failure (n) 2 1 Cirrhosis (n) 1 2 Gastrointestinal Bleeding (n) 2 3 Respiratory Failure (n) 1 7 Atrial fibrillation (n) 3 1 Encounters (n) 24 57 Weight (kg), median (IQR) 80 (68-90) 95 (83-98) Body Mass Index (kg/m2), median (IQR) 28 (26-31) 33 (26-37) Tidal Volume (mL), median (IQR) N/A 450 (420 - 500) Tidal Volume/IBW (mL/kg), median (IQR) N/A 8 (7-9) Respiratory Rate (BPM), median (IQR) 16 (14-18) 21 (18-22) Positive End Expiratory Pressure (cmH2O), median (IQR) Inotropes (n) N/A 5 (5-5) 0 0 Vasopressors (n) 0 12 Table 1: Anthropometric and clinical characteristics of patients. J Pulm Respir Med, an open access journal ISSN: 2161-105X Volume 8 • Issue 6 • 1000479
Citation: Stern K, Pillai R, Chowdhury S, Baydur A (2018) Assessment of Hemodynamic Changes during Mechanical and Spontaneous Ventilation by Variations in Pulse Oximetry Waveform in Critically Ill Patients Undergoing Hemodialysis: A Pilot Study to Evaluate Reliability of a Noninvasive Techniquen. J Pulm Respir Med 8: 479. doi: 10.4172/2161-105X.1000479 Page 4 of 6 contributing to this finding include an increase in delay of lung-to- finger circulation time, caused by transient decreases in cardiac output related to marked fluctuations in intrathoracic pressure. Cardiac output can also be depressed by sepsis and circulating inflammatory cytokines [25-28]. Ear and finger probes come with a clip, which prevents venous stasis and produces a more reliable arterial waveform [29,30]. Forehead plethysmography can be influenced by the presence of a strong venous signal, which can lead to misinterpretation of the plethysmographic waveform in patients with a forehead probe. Only 2 of our patients were monitored with a forehead probe, with a finger probe being used in the rest. We did not compare phase lags before and after UF, but one would expect a decrease in the phase lag if excess intravascular volume is removed and cardiac and stroke volume increase. Limitations There are several limitations to this study. Certain factors contributed to the variability of the relationship of ΔP and ΔS to volume removed (or added) during UF or HD, including age of the patient (influencing peripheral vascular tone), heterogeneity of diagnoses, use of vasopressors, myocardial suppression by endotoxin and cytokines, presence of heart failure, differences amongst ventilator settings and modes, and respiratory mechanics [12]. In addition, as indicated previously, we did not have the means to estimate intravascular volume. Most patients in this study were evaluated in volume control mode. Variability in pulse oximetry waveforms has yet to be evaluated in other ventilation modes. Patients were included in the study as samples of convenience, which predisposes to bias and sampling error. Regarding respiratory mechanics, recent studies have shown that driving pressure (difference between airway plateau pressure and positive end-expiratory pressure, PEEP) is more closely related to pulse waveform amplitude and baseline fluctuations than mean or plateau pressure alone [31,32]. Documentation of plateau pressure was available in only a few of our patients, and driving pressure was not calculated in any. Many factors including cardiac arrhythmias, low tidal volume ventilation, low respiratory compliance, which are particularly important in ARDS, limit the use of pulse pressure variation analysis [33]. Four of our patients had atrial fibrillation which can distort or dampen pulse pressure responses [12,33]. In addition, we did not assess the use of neuromuscular blockade in our cohort. Paralysis may increase the reliability of the signal [15]. Clinical studies have confirmed the poor reliability of PPV in predicting volume responsiveness in patients with ARDS, ventilated according to the currently recommended lung protective strategy which entails delivery of TVs of 6 mL/kg or less. Although a PPV >10-12% is reliable, a lower PPV (<10%) may fail to detect response to volume administration, although use of the driving pressure may circumvent this challenge [32]. Thus, performance of alternative preload responsiveness tests such as passive leg raising or end-expiratory occlusion tests, may be necessary when low PPV values are measured. Two of our patients had cirrhosis with accompanying ascites. The cyclical respiratory variations of ΔP and ΔS during ultrafiltration or HD might be altered in the case of intra-abdominal hypertension [34], particularly if it is associated with right heart failure or pulmonary hypertension associated with cirrhosis. Despite these limitations, our study showed a statistically significant increase in ΔS following UF when all patients were considered. Given the potential wide applicability of a common and noninvasive tool to measure intravascular volume during UF, we believe these findings Figure 4: Numbers of respiratory cycles vs coefficient of variation of (a) ΔS pre- ultrafiltration (UF), (b) ΔS post-UF, (c) ΔP pre-UF, and (d) ΔP post-UF. On the vertical axis, variability is expressed as coefficient of variation, in decimals. The horizontal axis represents the number of respiratory cycles over which ΔP and ΔS were computed from each cardiac cycle. Data are obtained from a subset of 10 randomly selected encounters in 5 patients. Each set represents one patient in the corresponding cohort. Note differences in the variability scale. output, and impair gas exchange. By contrast, in volume depleted individuals, by increasing pleural pressure and transpulmonary pressure, positive pressure ventilation may reduce systemic venous return, i.e., right ventricular (RV) filling, leading to a decrease in left ventricular (LV) preload during the expiratory period because of the long pulmonary transit time of blood [13-15,20-22]. These respiratory changes in LV preload may induce cyclic changes in LV stroke volume. In this connection, we expected ΔP and ΔS in MV patients to increase after UF in the case of volume overloaded patients. Despite statistical significance in some cohorts, however, we noted a heterogeneous change in ΔS after UF, with some patients exhibiting minimal changes in ΔS while others showed a large increase in ΔS. We did not measure intravascular volume and therefore cannot be certain as to where on the Frank-Starling curve the patient was situated at time of UF and interpret the significance of changes in ΔP and ΔS following UF. In addition, while such changes may occur during spontaneous breathing, pleural pressure and hence transpulmonary pressure swings do not generate as marked variation in ΔP and ΔS as they do with positive pressure ventilation. The respiratory variability in the pulse oximetry waveform is expected to be a noisier signal when compared to PPV studies looking at the intraarterial waveform. Pulse oximetry is more readily affected by vasomotor tone, vasomotion, drugs, cutaneous pigments, edema, pain, and metabolic states. In addition, commercial pulse oximeters may have filters built in, which alter the “raw signal” and possibly respiratory variations by the preprocessing of the device [23]. Finally, as expected, the coefficient of variation for both ΔP and ΔS diminished as the numbers of respiratory cycles analyzed increased (Figure 4). These findings are similar to those described by De Backer et al. [24]. Increasing the number of respiratory cycles analyzed may provide a more accurate measurement of ΔP and ΔS before and after UF. We found a phase lag between arterial pulse and plethysmographic peak-to- peak recordings in the 12 patients in which the phase angle between the two variables was computed. In our cohort, the mean (±SD) heart rate was 88 (±18) beats per minute. Since the phase angle (in degrees) φ = time delay Δt × frequency f (in Hertz) × 360, and mean φ was 79 degrees, then t computed to be 0.15 sec. Important factors J Pulm Respir Med, an open access journal ISSN: 2161-105X Volume 8 • Issue 6 • 1000479
Citation: Stern K, Pillai R, Chowdhury S, Baydur A (2018) Assessment of Hemodynamic Changes during Mechanical and Spontaneous Ventilation by Variations in Pulse Oximetry Waveform in Critically Ill Patients Undergoing Hemodialysis: A Pilot Study to Evaluate Reliability of a Noninvasive Techniquen. J Pulm Respir Med 8: 479. doi: 10.4172/2161-105X.1000479 Page 5 of 6 warrant further investigation. Future Studies The statistically significant increase in ΔS following UF when all patients were considered requires interpretation with caution. This relationship may depend on respiratory status, as we were not able to show a statistically significant increase in the MV patients and there may be a decrease in SB patients. In addition, the association between net intravascular volume removed and ΔP and ΔS was weak and we noted large variability in the ΔS values. This relationship requires further studies with larger samples sizes for clarification. Future studies should employ a means to estimate intravascular volume before and after UF such as inferior vena cava collapsibility index, stroke volume variation or PLR maneuvers with invasive or noninvasive measurements of hemodynamics. To improve the reliability of the pulse oximetry waveform, the raw signals should be obtained and measured over more respiratory cycles with a larger sample size. With improved measurements of baseline intravascular volume, the rate of volume removal over time should be reexamined. A study looking at the effects of respiratory mechanics on pulse waveform amplitude would measure driving pressures, plateau pressures, and esophageal pressures. Conclusion The findings of this hypothesis-generating study support a potential clinical application of SpO2 waveform variability in evaluating intravascular volume status in patients who undergo ultrafiltration. In general, ultrafiltration results in an increase in ΔS, a finding attributable to the reduction in intravascular volume. However, this relationship may depend on respiratory status, which requires further investigation. Prospective studies utilizing methods that accurately estimate baseline intravascular volume and examine how the rate of volume removal over time are related to changes in ΔP and ΔS are needed. 9. Yamakage M, Itoh T, Jeong SW, Namiki A (2005) Variation of “pulse amplitude” measured by a pulse oximeter may help predict intravascular volume. Can J Anesth 52: 207-208. 10. Desebbe O, Cannesson M (2008) Using ventilation-induced plethysmographic variations to optimize patient fluid status. Curr Opin Anaesthesiol 21: 772-778. 11. Cannesson M, Awad AA, Shelley K (2009) Oscillations in the plethysmographic waveform amplitude: Phenomenon hides behind artifacts. Anesthesiol 111: 206-207. 12. Landsverk SA, Hoiseth LO, Kvandal P, Hisdal J, Skare O, et al. (2008) Poor agreement between respiratory variations in pulse oximetry photoplethysmographic waveform amplitude and pulse pressure in intensive care unit patients. Anesthesiol 109: 849-855. 13. Magder S (2004) Clinical usefulness of respiratory variations in arterial pressure. Am J Respir Crit Care Med 169: 151-155. 14. Marik PE, Cavallazzi R, Vasu T, Hirani A (2009) Dynamic changes in arterial waveform derived variables and fluid responsiveness in mechanically ventilated patients: A systematic review of the literature.Crit Care Med 37: 2642-2647. 15. Michard F, Boussat S, Chemla D (2000) Relation between respiratory changes in arterial pulse pressure and fluid responsiveness in septic patients with acute circulatory failure. Am J Respir Crit Care Med 162: 134-138. 16. Inrig JK, Patel UD, Toto RD (2009) Decreased pulse pressure during hemodialysis is associated with improved 6-month outcomes. Kidney Int 76: 1098-1107. 17. Concise Encyclopedia of Physics (2002) McGraw-Hill Education. 18. Pillai R, Chowdhury S, Kaptein E, Baydur A (2014) Change in pulse oximetry waveform before and after hemodialysis and ultrafiltration in critically ill patients may reflect hemodynamics. Am J Respir Crit Care Med 191: A5213. 19. Dixon WJ, Massey JF (1983) Introduction to statistical analysis (4th ed.) New York, NY: McGraw-Hill Education. 20. Pinsky MR (2017) Choosing sides in predicting fluid responsiveness. Am J Respir Crit Care Med 195: 973-974. 21. Magder S (2012) Bench-to-bedside review: An approach to hemodynamic monitoring - Guyton at the bedside. Crit Care 16: 236. 22. Katz AM (2008) The “modern” view of heart failure: How did we get here? Circ Heart Fail 1: 63-71. Acknowledgement 23. Addison PS (2014) A review of signal processing used in the implementation of the pulse oximetry photoplethysmographic fluid responsiveness parameter. Anesth Analg 119: 1293-1306. The authors thank Dr. Elaine Kaptein for her review of this manuscript and helpful comments. References 24. De Backer D, Taccone FS, Holsten R, Ibrahimi F, Vincent JL (2009) Influence of respiratory rate on stroke volume variation in mechanically ventilated patients. Anesthesiol 110: 1092-1097. 1. Morélot-Panzini C, Lefort Y, Derenne JP, Similowski T (2003) Simplified method to measure respiratory-related changes in arterial pulse pressure in patients receiving mechanical ventilation. Chest 124: 665-670. 25. Coraim F, Fasol R, Stellwag F, Wolner E (1985) Continuous arteriovenous hemofiltration (CAVH) after cardiac surgery. Contin Arter Hemofiltr :116-124. 2. Pinsky MR (2004) Using ventilation-induced aortic pressure and flow variation to diagnose preload responsiveness. Intensive Care Med 30: 1008-1010. 26. Grootendorst AF, van Bommel EFH, van der Hoven B, van Leengoed LAMG, van Osta ALM (1992) High volume hemofiltration improves right ventricular function in endotoxin-induced shock in the pig. Intensive Care Med 18: 235- 240. 3. Shamir M, Eidelman L, Floman Y, Kaplan L, Pizov R (1999) Pulse oximetry plethysmographic waveform during changes in blood volume. Br J Anaesth 82: 178-181. 27. Coraim FJ, Coraim HP, Ebermann R, Stellwag FM (1986) Acute respiratory failure after cardiac surgery. Crit Care Med 14: 714-718. 4. Bendjelid K (2008) The pulse oximetry plethysmographic curve revisited. Curr Opin Crit Care 14: 348-353. 28. Schetz M, Ferdinande P, Van den Berghe G, Verwaest C, Lauwers P (1995) Removal of pro-inflammatory cytokines with renal replacement therapy: sense or nonsense?. Intensive Care Med 21: 169-176. 5. Feissel M, Teboul JL, Merlani P, Badie J, Faller JP, et al. (2007) Plethysmographic dynamic indices predict fluid responsiveness in septic ventilated patients. Intensive Care Med 33: 993-999. 29. Shelley KH, Tamai D, Jablonka D, Gesquiere M, Stout RG,et al. (2005) The effect of venous pulsation on the forehead pulse oximeter wave form as a possible source of error in SpO2 calculation. Anesth Analg 100: 743-747. 6. Natalini G, Rosano A, Taranto M, Faggian B, Vittorielli E, et al. (2006) Arterial versus plethysmographic dynamic indices to test responsiveness for testing fluid administration in hypotensive patients: a clinical trial. Anesth Analg 103: 1479-1484. 30. Desgranges FP, Desebbe O, Ghazouani A (2011) Influence of the site of measurement on the ability of plethysmographic variability index to predict fluid responsiveness. Br J Anaesth 107: 329-335. 7. Wyffels PAH, Durnez PJ, Helderweirt J, Stockman WMA, De Kegel D (2007) Ventilation-induced plethysmographic variations predict fluid responsiveness in ventilated postoperative cardiac surgery patients. Anesth Analg 105: 448- 452. 31. Vallée F, Richard JCM, Mari A (2009) Pulse pressure variations adjusted by alveolar driving pressure to assess fluid responsiveness. Intensive Care Med 35: 1004-1010. 8. Cannesson M, Attof Y, Rosamel P (2007) Respiratory variations in pulse oximetry plethysmographic waveform amplitude to predict fluid responsiveness in the operating room. Anesthesiol 106: 1105-1111. 32. Muller L, Louart G, Bousquet PJ (2009) The influence of the airway driving pressure on pulsed pressure variation as a predictor of fluid responsiveness. J Pulm Respir Med, an open access journal ISSN: 2161-105X Volume 8 • Issue 6 • 1000479
Citation: Stern K, Pillai R, Chowdhury S, Baydur A (2018) Assessment of Hemodynamic Changes during Mechanical and Spontaneous Ventilation by Variations in Pulse Oximetry Waveform in Critically Ill Patients Undergoing Hemodialysis: A Pilot Study to Evaluate Reliability of a Noninvasive Techniquen. J Pulm Respir Med 8: 479. doi: 10.4172/2161-105X.1000479 Page 6 of 6 Intensive Care Med 36: 496-503. syndrome. Crit Care 15: R85. 33. Lakhal K, Ehrmann S, Benzekri-Lefèvre D (2011) Respiratory pulse pressure variation fails to predict fluid responsiveness in acute respiratory distress 34. Malbrain MLNG, De Waele JJ, De Keulenaer BL (2015) What every ICU clinician needs to know about the cardiovascular effects caused by abdominal hypertension. Anestezjol Intens Ter 47: 388-399. J Pulm Respir Med, an open access journal ISSN: 2161-105X Volume 8 • Issue 6 • 1000479