Using Sparse Matrix Reordering Algorithms for Cluster Identification
100 likes | 279 Vues
Using Sparse Matrix Reordering Algorithms for Cluster Identification. Chris Mueller Dec 9, 2004. Undirected graphs can be rendered as lower triangles, with each edge is displayed so that i <= j. Visualizing a Graph as a Matrix.

Using Sparse Matrix Reordering Algorithms for Cluster Identification
E N D
Presentation Transcript
Using Sparse Matrix Reordering Algorithms for Cluster Identification Chris Mueller Dec 9, 2004
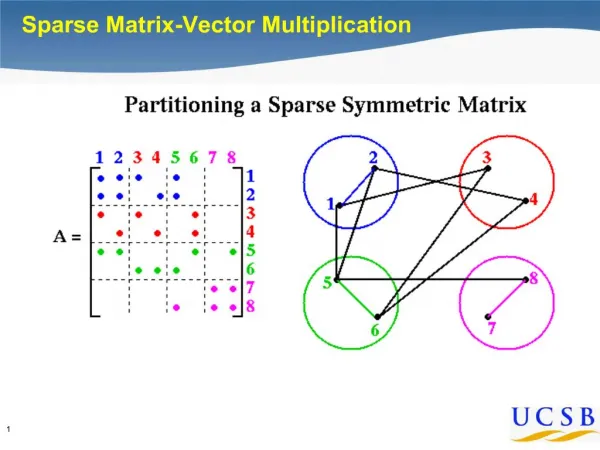
Undirected graphs can be rendered as lower triangles, with each edge is displayed so that i <= j. Visualizing a Graph as a Matrix Each row and column in the matrix corresponds to a node in the graph. The nodes are ordered the same in the rows and columns, so node 10 is represented by row=10 and col=10. Each edge between two nodes (a,b) is rendered as a dot at (i,j) where i is the row for a and j is the column for b. The solid diagonal shows the identity relationship for each node.
Visually Identifying Clusters Dense areas in the matrix reveal potential clusters. Some dense areas may be in the same row or column as others, suggesting a relationship. Reordering the nodes (rows/cols) can reduce the noise in the display and highlight clusters.
(Some) Previous Work The basic idea of visualizing relational data as a reordered matrix has been around since the early days of computer science. Some examples are: The Reorderable Matrix (Bertin, 1981) GAP Generalized Association Plots (Chen, 2002) Block Clustering (Hartigan, 1972) Bertin (1981), Graphics and Graphic Information Processing. From http://www.math.yorku.ca/SCS/Gallery/bright-ideas.html www.stat.sinica.edu.tw/SLR/PDF/ 吳漢銘-Cluster_Lecture_040206-new.pdf
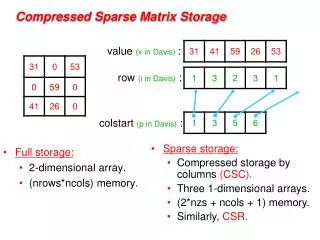
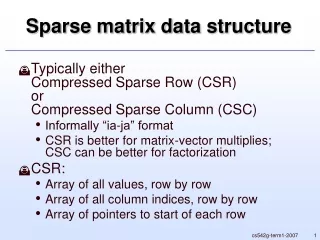
0 1 2 3 9 3 0 3 4 8 0 1 3 5 8 0 1 9 3 0 4 0 1 8 0 1 3 9 0 4 0 1 8 0 1 9 3 0 4 0 1 8 0 [ n 0 1 1 9 0 0 3 4 8 ] [ 1 0 1 n 3 0 0 9 n 8 4 n ] Sparse Matrices Matrices are the basic data structure for most numerical computations: Sparse matrices are matrices that do not need explicit values for each element: Note that zeros may be important and cannot always be excluded from that matrix. Sparse matrices can be stored in memory in data structures that are more compact that 2D arrays: Sparse matrix reordering algorithms reorder the elements in the matrix to achieve better use of memory or computational resources: Swapping column 1 and 2 reduced the bandwidth to 3, decreased the amount of storage required by 2 elements, and removed 2 empty elements. The bandwidth is the number of diagonals required to store the matrix. In this example, the bandwidth is 4. The banded representation stores only the diagonals that have values:
2 3 1 5 7 6 4 Minimizing Non-Zero Structure: Modified Minimum Degree 5 MMD(matrix): Represent the matrix as a graph Order nodes based on degree 7 8 6 9 1 2 4 3 Sparse Matrix Reordering Algorithms Bandwidth Minimization: Reverse Cuthill-McKee and King’s Algorithm RCM(matrix): Represent the matrix as a graph Choose a suitable starting node For each node reachable from the current node: Output the node Find all unvisited neighbors Order them based on increasing degree Visit them in that order King’s algorithm is similar but it orders based on edges out of the current cluster rather than total edges. Note that these algorithms are stochastic in the choice of starting nodes and ordering for nodes with the same degree.
Reordering the COG Database Basic Protocol: • Filter edges based on FASTA score • cmp2 is original data, cmp90, cmp200 are filtered • Shuffle the data • For each sorted and shuffled graph • Identify the connected components • Apply RCM and King’s algorithm to each component • Apply MMD to the entire graph
Results by the Numbers (but the pictures show sooo much more…)
Visualization Key Green lines show the extent of a COG family. Red dots are edges Black dots show the elements in the family. Blue dots are the COG families for the node in column j. Both axes have the nodes in the same order
Discussion • All algorithms worked as expected • However, the matrix ordering goals were too simple to yield good cluster clusters. • Possible Future Work • Extended algorithms that allow more information to be used • Exploit features of ordering strategies to do a second pass that generates better clusters? • Hypergraph reordering • (demo of reordering by hand)