Download
1 / 42
420 likes | 514 Vues
CSMEP is a collaborative forum for regional fish and wildlife agencies, tribes, and federal & state agencies to develop a monitoring program. Focus areas include status and trends, habitat, hydro, hatchery, harvest, and integration. The project aims to improve data quality to inform major decisions in the Columbia Basin.

E N D
Collaborative Systemwide Monitoring and Evaluation Project (CSMEP) Presentation to PNAMP Steering Committee August 21, 2007
Presentation Outline 1. CSMEP Overview 2. Examples of CSMEP Work Products 2.1 Status and Trend M&E 2.2 Habitat M&E 2.3 Hydro M&E 2.4 Hatchery M&E 2.5 Harvest M&E 2.6 Integration of M&E 3. Summary & Future Plans
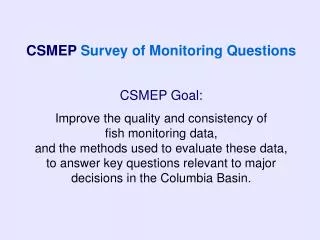
CSMEP is an M&E Coordination Forum for Fish and Wildlife Agencies and Tribes Aforum for Federal, State Agencies and Tribes to collaboratively develop a regional M&E program, consistent with: • 2000 FCRPS BiOp • Fish and Wildlife Program • Subbasin planning • Recovery Planning Vision:improve the quality, consistency, and focus of fish populationandhabitatdata to answer key M&E questions relevant to major decisions in the Columbia Basin
CBFWA ESSA Technologies Ltd. Tribal Agencies CRITFC Nez Perce Tribe Colville Tribes Yakama Nation Umatilla Tribes Consultants Eco Logical ResearchQuantitative Consultants PER WEST State Agencies IDFG ODFW WDFW Federal Agencies NOAA USFWSEPA DFO Participants and Approach
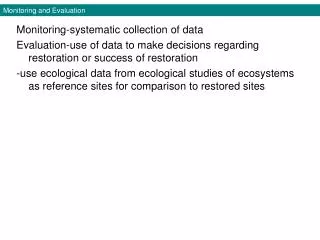
2.1 Status and Trends M&E Purpose: Assess viability of the population and overall management scheme. Status and Trends will tell you what the population is doing but not why.
CSMEP Pilot for Snake Basin; learn from this and extend to other regions
Status and Trends: a Management Example Priority Question: Are Snake River spring/summer Chinook salmon viable using IC-TRT guidelines? Related Decision: Has there been sufficient improvement in the population status of Snake River spring/summer Chinook salmon to justify delisting and allow removal of ESArestrictions?
How likely is the correct decision with different levels of monitoring intensity? Data Needs: • Abundance • Productivity • Spatial structure • Diversity Viability Status: • Not Viable • Maintained • Viable • Highly Viable Technical Recovery Team viability criteria We used a model to test the ability of monitoring programs to correctly assess spring/summer Chinook salmon population viability in the Snake River ESU using a simulated abundance dataset.
A single run of the simulation Status quo 55% correct Medium 87% correct High 94% correct
Objectives by Alternatives Matrix:Status & Trends Designs Status and Trends Subgroup
Results and Conclusions for Status & Trends M&E • TRT rule set is conservative, so high uncertainty results in conservative viability assessments. • Weakness of status quo monitoring design for Snake Pilot: • lack of spatial structure information. • Lack of an abundance estimate in the non-index areas for populations without weirs. • One MPG lacks a weir. • The medium design cost less than the status quo, yet performs better (for this question). • Measurement error may be less than year to year variability, causing small difference between medium and high designs’ reliability
2.2 Habitat Effectiveness MonitoringLemhi River example The Lemhi Habitat Conservation Plan (HCP) The task: Apply CSMEP’s adapted DQO process to a habitat effectiveness monitoring example • Lemhi Basin:heavily impacted with agriculture diversions and consequent passage issues • 10-17 tributary reconnection projects planned under Lemhi HCP • Phased in over the next 35 years
From Questions to Designs To what degree have these actions affected fish populations in the Lemhi Basin? Developed a general “Question Clarification Process” to make M&E designs rigorous Monitored effects: salmon distribution, survival, productivity What are the mechanistic connections between recovery actions, key habitatattributes and fish responses?
Costs of CSMEP Designs Top-Down = based on per project costs and contracting history Bottom-up = based on cost per unit time per person multiplied by the sample sizes identified in the plans.
Habitat Effectiveness M&EResults & Conclusions • Identifying mechanistic effects requires more intense M&E • Effectiveness monitoring may fulfill requirements of status and trends monitoring • A one-size-fits-all template for habitat effectiveness monitoring is not workable • Aspects of the design template for the Lemhi River habitat effectiveness monitoring project may be transferable to other systems.
2.3 Hydro Action Effectiveness • Hydro decisions occur at multiple scales: • Operations at individual projects (spill, bypass, RSW) • Overall operations (within season transport, performance measure compliance) • Longer term hydro decisions (flow, transportation, system configuration) • Adequacy of hydrosystem operations for population recovery
CSMEP Hydro M&E Analyses of Survival Rates(SARs, TIRs, Passage survival)
? ? ? ? ? ? ? ? ? ? ? ? X X X X X X X X X X What is our ability to estimate in-river survival from LGR to BON using different M&E designs? Survival exceeds standard Survival below standard Uncertain, confidence intervals straddle standard
Objectives by Alternatives Matrix:Hydro Example – In-River Survival
Hydro M&E Conclusions • Optimal design & confidence level in answers depends on: • spatial and temporal scales • decision criteria, and • true value of parameter being estimated relative to target. • Increasing number of tags/year: • can improve precision of annual estimates; but • doesn’t help multiple-year averages (# years more important) • Ability to integrate tags from multiple sources, for multiple questions: • depends on how questions are framed, but • great potential for using PIT-tags, and multi-year averages for many scales & questions
2.4 Hatchery Effectiveness Uncertainty regarding the effects of hatchery fish limit management evaluations of : • Impacts and benefits of hatcheries. • De-listing – how do hatchery fish “count” in productivity estimates? • Habitat Action Effectiveness – do hatchery fish reduce Relative Reproductive Success (RRS) and thus mask productivity improvements? • Effectiveness of hatcheries for target populations.
Hatchery Evaluations • Existing hatchery M&E in the basin is primarily focused investigations at the project scale. • Assessing more generic hatchery impacts are likely to require larger spatial scale designs. • Designs were developed to investigate the effects of hatchery Straying and Relative Reproductive Success.
What is our ability to assess hatchery straying? Status Quo • Stray rates/ratios currently calculated using CWT recoveries in non-random locations. CSMEP Alternative • Representative distribution of tag recovery effort, increasing sampling intensity & improved reporting. • No need to sample every population, allows statistical extrapolation
Conclusions • Problems with Status quo • Current straying estimates and RRS studies are not representative, are likely biased, and cannot be used in a predictive fashion for un-sampled programs or populations. • CSEMP Designs: • Do not address all hatchery uncertainties. • Focus on PRIMARY uncertainties that limit management decisions. • Useful for aggregate and individual benefit/risk evaluations.
2.5 Harvest Effectiveness M&E Key Management Decision: • Open or close fisheries based on allowable Impacts on listed stocks? Priority Questions: • What are the in-season, post season estimates of run size & escapement for each management group (target & non-target)? • How do they compare to preseason estimates? • What is the target and non-target harvest and when is it projected to reach allowable levels? .
Weakness of Current Harvest M&E • Fisheries are managed to keep listed-stock mortality (“Impacts”) less than permitted rates, but • Status quo harvest monitoring generally does not provide precision estimates. • Improved monitoring needed for more accurate and precise information for models (or run reconstructions) used in population viability, status, and trend assessment
Consequences of poor (biased or imprecise) estimates Underestimate Impact – over harvest of listed stocks Overestimate Impact – lost opportunities for user groups Poor impact estimates reduce the utility of harvest mortality estimates in run reconstructions, and in assessments of status, trends, and viability Assess Precision and Bias of Impact Estimates
Columbia River Fisheries Mainstem Sport LCR Commercial Zone 6 Tribal Tributary Key Fisheries Metrics Run-Size Estimates Stock Composition Harvest Number Release Rates Post-Release Mortality Rates Identify Areas of Uncertainty and Bias
Harvest Subgroup Harvest M&E Conclusions • Run-Size Estimates – improved at modest cost using available data and methods • Stock Composition – could be improved with PIT tags, GSI sampling, or index stock • Harvest Number – best in commercial fisheries; good in tribal and sport fisheries • Release Rates – good in commercial fisheries; potential biases in sport fisheries • Post-Release Mortality Rates – are based on limited studies; difficult to estimate
2.6 Integration of M&EWhat are the features of an ‘integrated’ monitoring program? • Scale integration:data can be used at the scale of interest for decisions (e.g. ESUs for viability analysis, population level for local management). • Integrates across separate monitoring programs:information gathered serves multiple functions (e.g. same PIT-tagged fish used for multiple evaluations); coordinated costing. • Integrates policy and technical domains:precision of data fits time frames and acceptable risks for decisions. • Integrates across life history:evaluate survival and habitat requirements throughout the life cycle. • Species integration: collect data for multiple species in an efficient manner.
Status and Trends Abundance, Productivity, Distribution PIT Tags PIT Tags Harvest Hatchery Integration example using PIT-tags Straying and Relative Reproductive Success studies Stock composition Age structure PIT Tags PIT Tags Habitat Hydrosystem Abundance, productivity, spatial structure, spatial diversity changes from habitat actions Survival studies PIT Tags
The Future of Collaborative Monitoring • Collaborative monitoring will become increasingly important as recovery plans are implemented • Coordination among federal, state and tribal agencies remains critical for developing logical cost-effective M&E (especially for fish populations that cross state and tribal boundaries) • CSMEP provides a forum for federal, state and tribal fish managers to develop cost-effective, and coordinated regional monitoring for status and trends and the 4-“H”s.