Filtering MAP Data With Excel
Join us in this interactive session to learn how to effectively filter and disaggregate data using Excel. Participants will explore the process of ordering and retrieving reports, unzipping files, and formatting Excel spreadsheets. Our hands-on practice will focus on filtering specific datasets, such as 6th-grade male students who scored above the 50th percentile in mathematics. By the end of the session, participants will understand the benefits of using Excel for data-driven decision-making and how to apply these skills in their own contexts.

Filtering MAP Data With Excel
E N D
Presentation Transcript
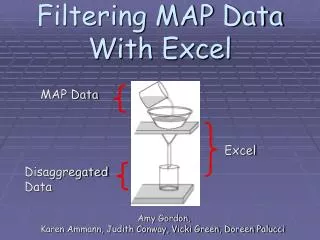
Filtering MAP Data With Excel MAP Data Amy Gordon, Karen Ammann, Judith Conway, Vicki Green, Doreen Palucci Excel Disaggregated Data
Objectives • Participants will: • Review how to order and retrieve reports • Unzip downloaded files • Format an Excel spreadsheet • Disaggregate data by filtering
Essential Question How would using Excel to disaggregate data be beneficial in making data-driven decisions?
Warm Up – Do Now First Things First: Review… • Reports need to be ordered and retrieved from the NWEA website • Reports need to be unzipped and saved in a folder
Text to Excel • Open with Excel • Format / Freeze / Filter
Guided Practice • Be sure you have logged in as yourself • Make a folder in your MY DOCUMENTS folder called NWEA Fall 2005 • Insert and open CD • Drag the January 12 folder to the new NWEA Fall 2005 folder
Guided Practice • UNZIP: • Right click on the zipped folder • Select EXTRACT ALL • Continue clicking NEXT and then FINISH • The new unzipped folder automatically opens
Independent Practice • Format the spreadsheet: • Bold header row • Increase width of columns • Freeze pane • Filter for the following: • 6th grade male students • Hispanic • In mathematics • Who scored above the 50th percentile
CLOSURE • Essential Question Discussed: • How would using Excel to disaggregate data be beneficial in making data-driven decisions? • Are there any questions that this filtering exercise did not answer?