Logical Line Fitting: A Key Step in Exploratory Data Analysis
This presentation by Shannon Guerrero at the NCTM 2008 Annual Meeting focuses on the importance of logical line fitting in the Exploratory Data Analysis (EDA) process. Highlighting a primarily graphical approach, it emphasizes the need to uncover the underlying structure of data, detect outliers, and maximize insights. The session discusses the relevance of curve fitting in relation to regression, offering techniques for modeling relationships between variables and making predictions. Attendees will learn how to effectively graph data and understand the implications of outliers in their analyses.

Logical Line Fitting: A Key Step in Exploratory Data Analysis
E N D
Presentation Transcript
Logical Line Fitting: One Step in the EDA Process by Shannon Guerrero Northern Arizona University NCTM 2008 Annual Meeting & Exposition Salt Lake City, UT April 2008
EDA(Exploratory Data Analysis) • Mostly graphical approach to data analysis • Emphasizes uncovering underlying structure of data, extract important variables, detect outliers/anomolies, test underlying assumptions, maximize insight into data set • Graph the data, graph the data, graph the data • Focus on sense-making rather than theory
Why curve fitting? • Applications in data analysis & algebra • “Analyses of the relationships between two sets of measurement data are central in high school mathematics” (p. 328 NCTM PSSM) • modeling, prediction, symbolic representation, correlation, regression, residuals
“Line of Best Fit” • Explains relationship between two variables with a straight line that “best fits” the data • Line may pass through some, none, or all of the points • Used to predict future values from existing values (interpolate vs extrapolate)
Outliers • An observation that lies outside the overall pattern of a distribution • For one variable, a convenient def’n is a point that falls more than 1.5 times the IQR above the 3rd quartile or below the 1st quartile • Examine outliers carefully and understand their appearance in your data set • Need to decide what to do with outliers – include or discard?
Curve Fitting vs. Regression • Power of curve fitting often lost as we revert right to regression calculations • Curve fitting is more general and an approximation • Equation found (using either method) can help uncover underlying structure of data, predict future values from past ones, model causal relationships, and maximize insight into a data set
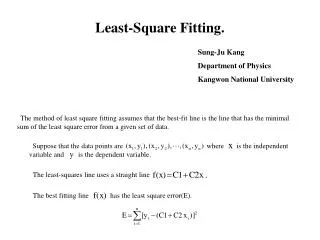
Linear Regression • Statistical approach to finding relationship between two variables • Least squares regression attempts to minimize the squared residuals (residual – difference between observed value and value given by model) • Assumption: for a fixed value of x the value of y is normally distributed with equal variations across x
r2 and residuals • residual – difference between an observed value and value predicted by regression line • residual plot is a scatterplot of regression residuals against the explanatory variable • helps us assess fit of regression line • r2 is another way to assess how well the line fits the data (the closer to 1 the better the fit)