Weather
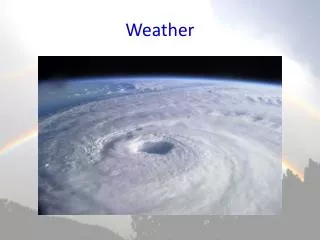
Weather. The Causes of Weather. Meteorology is the study of atmospheric phenomena. Meteorologists study events that cause the atmosphere to change try to predict the weather. Weather and Climate. Weather is the current state of the atmosphere.

Weather
E N D
Presentation Transcript
The Causes of Weather • Meteorology is the study of atmospheric phenomena. • Meteorologists • study events that cause the atmosphere to change • try to predict the weather
Weather and Climate • Weather is the current state of the atmosphere. • Climate describes the average weather over a long period of time • Usually over 30+ years
Air Masses • Large body of air that takes on the characteristics of the area over which it forms. • Source region = area where an air mass forms
Air Masses • Classifying Air Masses • Air masses are classified according to their source regions. • The main types of air masses are: • continental tropical (cT) • maritime tropical (mT) • continental polar (cP) • maritime polar (mP) • arctic (A)
The Coriolis Effect • Due to Earth’s rotation • Causes moving particles to be deflected to the right in the northern hemisphere and to the left in the southern hemisphere.
Global Wind Systems • There are three basic zones, or wind systems, in each hemisphere. • Air is heated and rises at the equator. • Low pressure • The air cools and sinks around 30o N & S. • High pressure
Global Wind Systems • Air is warmed again near 60o N & S • Low pressure • It cools and sinks at the poles • High pressure
Global Wind Systems • Air moves from high pressure to low pressure • Tradewinds: • Wind blows from 30o toward the equator • Prevailing Westerlies: • Wind blows from 30o towards 60o • Polar Easterlies: • Wind blows from the poles toward 60o
Global Wind Systems LOW High LOW High LOW High
Jet Streams • Jet streams are narrow bands of high-altitude, westerly winds. • They separate the global wind systems
Fronts • Air masses with different characteristics collide. • The narrow region separating two air masses of different densities.
Fronts • Colliding air masses can bring dramatic changes in weather.
Fronts • Cold Fronts • Cold air displaces warm air and forces the warm air up along a steep front. • Produces clouds, showers, and thunderstorms
Fronts • Warm Fronts • Warm air displaces cold • Gradual frontal slope rather than a steep one. • Clouds and precipitation
Fronts • Stationary Fronts • Stalled boundary between warm air and cold air • Seldom have extensive clouds or heavy precipitation
Fronts • Occluded Fronts • Cold air overtakes a warm front • Precipitation is common.
Pressure Systems • High-Pressure Systems • Air sinks, so that when it reaches Earth’s surface it spreads away from the center. • The Coriolis effect • clockwise rotation in the northern hemisphere. • counter-clockwise in the southern.
Pressure Systems • Low-Pressure Systems • Air rises, causing an inward flow toward the center and then upward. • Counterclockwise in the northern hemisphere • Clockwise in the southern hemisphere.
Surface Analysis • Isoplethsare lines that connect points of equal or constant values, such as pressure or temperature, on a weather map. • Lines of equal pressure are called isobars.
Surface Analysis • You can tell how fast wind is blowing in an area by noting how closely isobars are spaced. • Close together = strong winds • Spread apart = weak winds
Weather Analysis • A station modelis a record of weather data for a particular site at a particular time. • Symbols are used to represent data.
Surface Analysis • Isobars also indicate the locations of high- and low-pressure systems.
Weather Forecasts • Weather systems change directions, speed, and intensity with time in response to changes in the upper atmosphere. • A reliable forecast must analyze data from different levels in the atmosphere.