
Frequency Tables
E N D
Presentation Transcript
Frequency Tables Statistics 2126
Introduction • Say we have a question like “Where are you from?” or “What is your favourite hockey team?” • How would we find out if we have some sort of effect • How would the population be distributed? • We have to somehow come up with a ‘chance’ distribution
How shall we attack this • Observed – expected • 5 -1 0 2 -3 -3 • We can’t just add these up because we would end up with a sum of 0 • Sound familiar? • Square ‘em! • 25 1 0 4 9 9
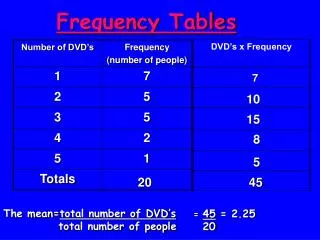
We’re always squaring stuff… • What if the expected values differed? • Well we should weight the squared deviations somehow • Divide by the expected • 25/10+1/10+4/10+9/10+9/10 = 4.8 • Add ‘em all up to get some estimate of the total deviation from the expected
How to read the χ2 table • df = number of values we can arbitrarily assign • 5 in our case • (there must be 60 rolls in total, so the last number is fixed)
Easiest statistic ever… • H0 all the frequencies are the same • Ha they are not • χ2cr = 11.07 • χ2obt < χ2cr • So we do not reject H0
So… • This is a 3 x 2 table • 3 rows and 2 columns • In general r x c table • We want to test if all of the proportions are equal • H0 p1 = p2 = p3 • Ha all ps are not equal
So how do we get the expected values? • We have to compare the observed value to the expected value • But it is hard to get what we would expect by chance • We let the data tell us what to do • (Row total) x (column total) / (table total)
Working out the expecteds • (24 x 24) / 72 for the Yes column • (24 x 48) / 72 for the No column • So we get a table of expected frequencies with 8 in the yes column and 16 in the no column • We expect some relapses but if all the drugs are the same the proportion should be the same
Degrees of Freedom At most we can assign two values arbitrarily
So… • In general the degrees of freedom for such a table are (r-1)(c-1) • In our case (3-1)(2-1) • 2cr = 5.99 • We reject H0 • The relapses are distributed differently than chance