Understanding Extratropical Cyclones: Formation, Evolution, and Case Study Analysis
390 likes | 513 Vues
This study focuses on the formation and evolution of extratropical cyclones, with particular emphasis on a notable case study that impacted the central United States, characterized by intense winds and heavy precipitation. The analysis includes an examination of November 1998's 500 hPa chart, illustrating key features such as the split polar vortex and baroclinic waves. We will explore the dynamics of these systems, their intensification, pressure changes, and the corresponding weather impacts. Such cyclones, typical in winter at middle and high latitudes, are crucial for understanding atmospheric circulation.

Understanding Extratropical Cyclones: Formation, Evolution, and Case Study Analysis
E N D
Presentation Transcript
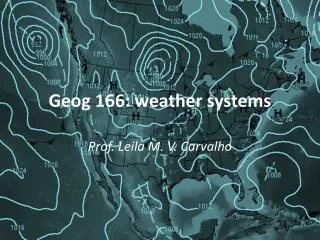
Geog 166: weather systems Prof. Leila M. V. Carvalho
objectives • The weather analysis will be focused first on the formation and evolution of extratropical cyclones • We will discuss a case-study that caused strong winds and heavy precipitation to parts of the central United States • It was unusually intense but typifies many features of winter storms in middle and high latitudes
Extratropical cyclones: case study example: November 1998 500hPa chart for 00UTC Polar Vortex is split into two regional cyclonic features (Russia and Northern Canada) Two ridges separate the two troughs Typical distance between two troughs : 50o of longitude or ~ 4000km Solid red lines denote axes of ridges and dashed red lines are axes of troughs
500hPa charts (contours 60m intervals (dKm) and relative vorticity (blue shading 10-4s-1). Right sea level pressure 4hPa interval and 1000-500hPa thickness (colors) • Baroclinic waves travel ~ 10m/s: wintertime climatological wind at 700Pa (steering level) • Successive ridges (or troughs typically ass at a fixed point on Earth at roughly 4 days (but it can be sometimes 1 or 2 days apart depending on the steering flow) • Baroclinic waves tend to be stronger over the oceans (as we have seen many times) but they can develop over land Frontal surfaces
Amplification of the wave • Note the intensification of the Low pressure system and how it “splits off the westerly to form a CUTOFF LOW (ISOLATED MINIMUM OF GEOPOTENTIAL HEIGHT FIELD) • That implies the existence of a closed cyclonic circulation • Note the tightening of the contours that imply the intensification of the winds around the low Note the intensification of the low pressure at the surface
Advection of temperature, amplification of the wave and the extratropical cyclone • The surface low is the EXTRATROPICAL CYCLONE • Note that pressure gradients increase with time showing the intensification of the low as the cold air moves southward and the warm air moves northward • In the beginning the surface Low is eastward of the trough but as the 500hPa and low level cyclone amplify they come into vertical alignment
Vorticity analysis indicates cyclonic vorticity related to the horizontal wind shear (u varies rapidly with y and v varies rapidly with x) Surface Low pressure system drops from 998 hPa at 00UTC to 978 hPa at 18UTC (bottom) to 968 at 00UTC (not shown) Nov 11=> 30hPa in 24h!!! 3x more rapid than the typical cyclone these maxima move eastward 9 hours later
500 hPa (thick black), 1000hPa height (thin black), 1000-500hPa thickness (dashed) Arrows: sense of the geostrophic wind • Amplification of the wave in the thickness field: advection of temperature by the wind • Note that the strengthening of the east-west gradient of temperature leads to the weakening of the North-south temperature gradient as the wave is growing • Surface low aligned with the 500hPa trough: weakening of the horizontal temperature advection Bottom: from text book: Atmospheric Circulation Systems: Palmen and Newton (p. 326)
In summary • The geostrophic wind field evolves from a highly baroclinic pattern (high gradients and strong vertical wind shear) into a more equivalent varotropic pattern (less directional shear of the lower tropospheric geostrophic wind field in fully developed baroclinic waves • Strong winds but weaker temperature gradients marks the end of the intensificaiton phase in the life cycle of the cyclone
Vertical velocity and 500hPa charts • Rising of the northward air in the region of warm advection • sinking air in the region of southward cold advection to the rear of the cyclone • Rising of warm air and sinking of cold air is indicative of a conversion of potential energy into kinetic energy • In baroclinic waves the potential energy is associated with the east-west temp gradients and the kinetic energy with the meridional wind component Rapid Intensification
Note that the juxtaposition of this inward-spiraling rising and subsiding air (“yin-yang” pattern) influences the pattern of rain and clouds
Frontal Zones • Narrow bands marked by sharp horizontal gradients and sometimes outright discontinuities in wind and temperature • Frontogenesis: development of frontal zones (initiated by large-scale horizontal deformation fields • Mesoscale circulations in the plane perpendicular to the fronts are instrumental in increasing temperature contrasts and organizing the distribution of precipitation into bands parallel to the fronts
Winds and pressure: cold frontBelow: sea level pressure, and surface winds • Pronounced wind shift, winds exhibit strong westerly component. To the east southerly wind component are dominant. Isobars bend sharply along the front • As a cold front pass in the NH there will be a shift in an anticyclonic sense (veering) from southerly to westerly
Winds and pressure: warm frontBelow: sea level pressure, and surface winds • Is a more subtle feature • Shows signal of advection around the surface low • As a warm front pass in the NH there will be a shift in an anticyclonic sense (veering) from southeasterly to southerly • Late stage there will be a junction of the two fronts: occluded front extends from the center of the surface low to a triple point when it meets the warm and cold front • When an occluded front pass a station the surface wind veers from southeasterly to southwesterly
Secondary cold front • A front which forms behind a frontal cyclone and within a cold air mass, characterized by an appreciable horizontal temperature gradient • Cause also winds to veer as it pass over a station
Temperature structure • The zone of relatively uniform temperature to the southeast of the surface low is referred to as the warm sector of a cyclone • The cold front marks the leading edge of the advancing colder air from the west
Close-up in the temperature and winds • To the east of the cold front the temperatures are relatively homogeneous • Proceeding westward from the front, temperatures drop by 10oC within the first few hundred of km • A cold front can be defined as the boundary of a frontal zone that is advancing in the direction of the warmer air. • A cold front at a station marks the beginning of a period of falling temperatures due to the wind shift Note that both fronts are embedded within troughs of low passage and their passage is marked by wind shifts and further decrease in temperature. The passage of a warm front is associated with a local increase in temperature
Stationary fronts • Fronts that exhibit little movement in either direction and are indicated on synoptic charts as dashed lines with alternating read and blue line segments • When an occluded front approach a station, surface air temperature rises, and after the front passes the station, the temperature drops (for a stationary observed it is like he/she was experiencing a back to back warm and cold fronts)
Occluded Front: Cold air moves faster than the warm air
What is the relationships Among Frontal Boundaries, Troughs and Ridges, Vorticity and Low and High Pressure Systems at the surface?
Northern Hemisphere Positive vorticity Negative vorticity Ascending Air Descending air Cold Warm • Low pressure systems are observed east of the upper level Troughs • High pressure systems are observed east of the upper level Ridges • Cold and warm fronts are related to low pressure systems at the surface. Frontal boundaries extend upward as we will see in the next slides
Vertical Cross Section: Div Cold air: denser than warm air Conv. As a cold Front moves toward a warmer region it lifts warmer air ahead of the front If the atmosphere is unstable or conditionally unstable cumulonimbus clouds and heavy precipitation may occur
Vertical Cross Section: Div Cold Conv. As a warm Front moves toward a colder region warmer air is lifted and shallow clouds are formed
Difficulties to locate fronts on the basis of gradients of surface air temperatures • Over Oceans: air temperature is strongly influenced by sea surface temperature • In mountainous terrain, large differences in station elevations mask the temperature gradients • Terrain effects, patchy nocturnal inversions, convective storms, urban heat islands effects can raise or lower the temperature and create gradients that can confuse the location of frontal systems
Moisture • Frontal zones tend to be marked by strong gradients in dew point and equivalent potential temperature, specially when the cold air is of continental origin and the warmer air is of marine origin (e.g. eastern USA). • During spring and summer, the moisture gradient is often a more reliable indicator of frontal positions • During summer, under conditions of southerly low level flow, there often exists a sharp contrast between humid air advected northward from the Gulf of Mexico and much drier air that has subsided along the eastern slopes of the Rockies: the boundary between these marine and continental air masses is referred to as Dry Line
Example of Dry line observed in a Td map: http://www.tornadochaser.net/dryline.html • Tornados can form along a dry line, in the presence of other triggering such as strong high level jets • http://www.crh.noaa.gov/lsx/?n=ap0206qlcs
Vertical Cross Section: Div Dry air is: denser than moist air Conv. As dry air moves toward a region with moist air it lifts humid air ahead and may form intense storms If the atmosphere is unstable or conditionally unstable cumulonimbus clouds and heavy precipitation may occur, including tornados
Hourly observations: cold front Secondary Front Cold Front Gage,Oklahoma rain
Hourly observations: warm front Bowling Green, Kentucky
Hourly observations: occluded front 975hPa! veering rain snow Marquette, Michigan
Surface weather rain Snow 00:00UTC 09:00UTC 18:00UTC
Snow rain 00:00UTC 09:00UTC 18:00UTC
Snow rain WV 18:00UTC WV 00:00UTC WV 09:00UTC
Precipitation as seen by radar 0620UTC Composite: 15:35 UTC
Some additional ideas about the evolution of frontal systems, cyclones and baroclinic waves:
Surface high- and low-pressure centers can migrate relative to the Rossby wave aloft. In (a), the surface low exists below the area of upper-level divergence, and the resultant uplift maintains or strengthens the cyclone.
Surface systems are generally guided by upper-level winds, so eventually the center of the low might be displaced to the zone where upper-level convergence occurs (b). The sinking air fills into the low, causing its demise. This process occurs as the cyclone undergoes the transition from its mature to occluding stages.