Exploring the Scientific Method: Understanding Research Questions and Hypotheses
This informative lab mapping title delves into the core elements of the scientific method, emphasizing the importance of research questions and hypotheses in guiding experiments. Covering topics such as independent and dependent variables, controlled variables, experimental and control groups, qualitative and quantitative data, graphs, analysis, and conclusions, this resource provides a comprehensive overview for conducting successful experiments.

Exploring the Scientific Method: Understanding Research Questions and Hypotheses
E N D
Presentation Transcript
Scientific Method Lab Mapping
Title • Informative • Not “cutesy” or “advertisement-y” • Includes important information on the subject of experiment
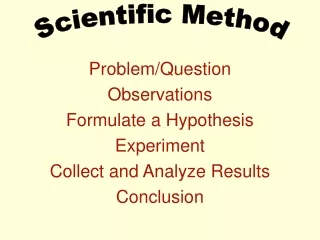
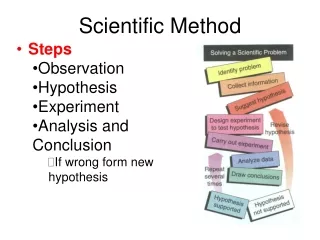
Problem • The research question is the single most important part of the scientific method. • Every part of your project is done to answer this question. • The research question is sometimes formed as a statement.
Hypothesis • proposed scientific explanation for a set of observations • A reasonable explanation supported by observation and/or research • In class, written in an “if, then” statement • Does not always appear in the “if, then” format
Independent Variable • “I the scientist changed this.” • Manipulated variable • Purposely changed • Experimental variable • what you test on the experimental group to see if makes a difference
Dependent Variable • What is being measured during the experiment. • Data • Results of experiment
Controlled Variables • Constants of experiment • What you keep the same so you can isolate and test a single (1) variable.
Experimental Group • Group tested on • a set of items or people under study to determine the effect of an event, a substance, or a technique • the group of participants in a clinical study who receive the actual drug or treatment being studied
Control Group • The group of participants in a clinical study who do not receive the drug or treatment • Can be given placebos • practically identical to the experimental group, although the experimental group is changed according to ONE (1) key variable of interest
Procedure • The procedure is a somewhat detailed, step - by - step description of how you conducted your experiment.
Qualitative Data • “quality” means good/useful • This is data you collect through observations using your 5 senses. • Subjective
Quantitative Data • “quantity” means numbers (#) • This is numerical data you collect during experiments.
Graph • Picture of data • Line, bar, circle/pie • Visually represents data • Helps to see patterns, relationships, or trends
Analysis • Examine and explain the data • the section in which you interpret your results • what happened and WHY! • if data does not support your hypothesis at all, you may explain why the results were different
Conclusion • statement of whether your data supported your hypothesis or not • Outcome as related to the data and the hypothesis