Download
1 / 1
10 likes | 87 Vues
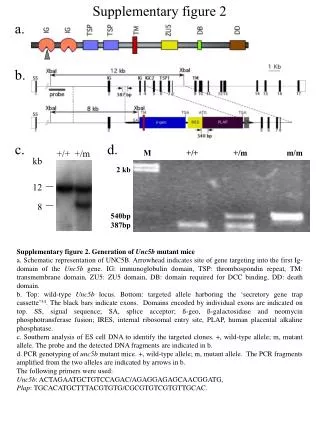
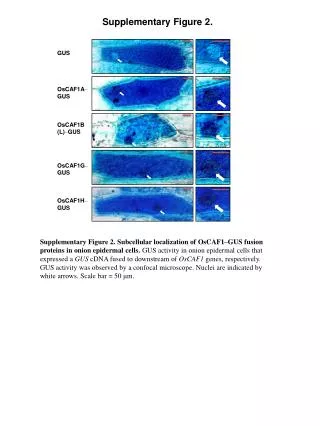
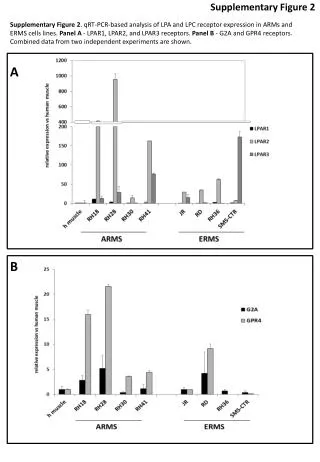
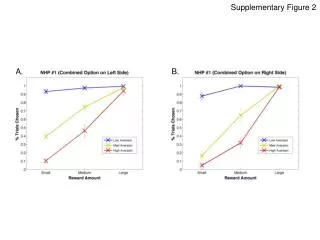
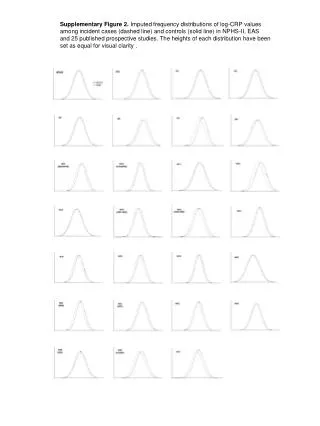
Compare log-transformed CRP values in incident cases and controls in NPHS-II, EAS, and 25 prospective studies. Distributions visually adjusted for clarity.

E N D
Supplementary Figure 2. Imputed frequency distributions of log-CRP values among incident cases (dashed line) and controls (solid line) in NPHS-II, EAS and 25 published prospective studies. The heights of each distribution have been set as equal for visual clarity .