Download
1 / 34
340 likes | 443 Vues
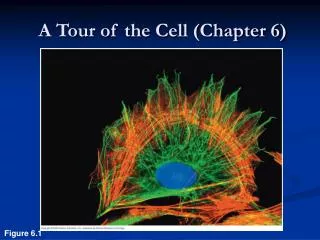
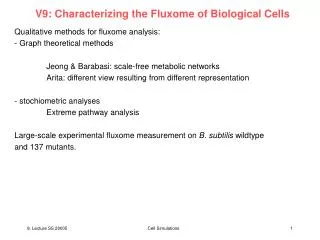
V9: Characterizing the Fluxome of Biological Cells. Qualitative methods for fluxome analysis: Graph theoretical methods Jeong & Barabasi: scale-free metabolic networks Arita: different view resulting from different representation stochiometric analyses Extreme pathway analysis

E N D
V9: Characterizing the Fluxome of Biological Cells • Qualitative methods for fluxome analysis: • Graph theoretical methods • Jeong & Barabasi: scale-free metabolic networks • Arita: different view resulting from different representation • stochiometric analyses • Extreme pathway analysis • Large-scale experimental fluxome measurement on B. subtilis wildtype • and 137 mutants. Cell Simulations
First breakthrough: scale-free metabolic networks (d) The degree distribution, P(k), of the metabolic network illustrates its scale-free topology. (e) The scaling of the clustering coefficient C(k) with the degree k illustrates the hierarchical architecture of metabolism (The data shown in d and e represent an average over 43 organisms). (f) The flux distribution in the central metabolism of Escherichia coli follows a power law, which indicates that most reactions have small metabolic flux, whereas a few reactions, with high fluxes, carry most of the metabolic activity. It should be noted that on all three plots the axis is logarithmic and a straight line on such log–log plots indicates a power-law scaling. CTP, cytidine triphosphate; GLC, aldo-hexose glucose; UDP, uridine diphosphate; UMP, uridine monophosphate; UTP, uridine triphosphate. Barabasi & Oltvai, Nature Reviews Genetics 5, 101 (2004) Cell Simulations
Different opinion According to the formal definition, in a small-world network, (i) most nodes (metabolites in our case) have a low connection degree, and the degree distribution follows a power law also referred to as scale-freeness; (ii) high-degree nodes, called hubs, dominate the network, and most nodes are clustered around hubs; and (iii) the average path length (AL; i.e., the average of the shortest path length over all pairs of nodes in the network) remains the theoretical minimum, that of a random graph. Because of its topology with few hubs, a small-world network may be resistant to random failures: any peripheral node is likely to have a low connection degree and is therefore expendable. In biological networks, the hubs are thought to be functionally important and phylogenetically oldest. Arita, PNAS 101, 1543 (2004) Cell Simulations
Different opinion Although several groups confirmed the small-world property of small-molecule metabolisms in multiple data sources, the details of their results differ depending on the purpose of the analysis and its data-preparation scheme. Notable differences are attributable to the reversibility of enzymatic reactions and to the treatment of metabolically ubiquitous compounds referred to as coenzymes or inorganics. Table 1 summarizes differences in the major analyses and compares the average path length (AL) and hub metabolites they identified. Arita, PNAS 101, 1543 (2004) Cell Simulations
Different opinion All of these studies used the same algorithmic procedure, and discrepancies are ascribable to the different aims of their network analyses. Jeong et al. computed the proximity of metabolites by regarding all substrates and products in the same reaction as adjacent (Fig. 1) Arita, PNAS 101, 1543 (2004) Cell Simulations
Basis for analysis To reproduce biochemical pathways in the traditional metabolic map, however, metabolites to be linked cannot be defined per se by compounds or reactions. The biochemical link between metabolites is context-sensitive; it depends on the conserved structural moieties in the adjacent reactions. To accurately compute the reaction connectivity as in the traditional metabolic map, we used digitally compiled atomic mappings, i.e., atomic position pairs between substrates and products corresponding to the substructural moieties conserved in each reaction. With this information, we reassessed the global properties of metabolic networks with special emphasis on the small-world hypothesis. Arita, PNAS 101, 1543 (2004) Cell Simulations
Basis for analysis Arita, PNAS 101, 1543 (2004) Cell Simulations
Results of Arita In Arita‘s conclusion, metabolic pathway discussions should not be based on substrate-level network topology. Because the superficial connectivity on metabolic maps does not always correspond to pathways, structural information of metabolites is indispensable for computing biochemical pathways. Arita, PNAS 101, 1543 (2004) Cell Simulations
Review from bioinformatics III: V19 Extreme Pathways introduced into metabolic analysis by the lab of Bernard Palsson (Dept. of Bioengineering, UC San Diego). The publications of this lab are available at http://gcrg.ucsd.edu/publications/index.html The extreme pathway technique is based on the stoichiometric matrix representation of metabolic networks. All external fluxes are defined as pointing outwards. Schilling, Letscher, Palsson, J. theor. Biol. 203, 229 (2000) Cell Simulations
Extreme Pathways – algorithm - setup The algorithm to determine the set of extreme pathways for a reaction network follows the pinciples of algorithms for finding the extremal rays/ generating vectors of convex polyhedral cones. Combine n n identity matrix (I) with the transpose of the stoichiometric matrix ST. I serves for bookkeeping. Schilling, Letscher, Palsson, J. theor. Biol. 203, 229 (2000) S I ST Cell Simulations
separate internal and external fluxes Examine constraints on each of the exchange fluxes as given by j bj j If the exchange flux is constrained to be positive do nothing. If the exchange flux is constrained to be negative multiply the corresponding row of the initial matrix by -1. If the exchange flux is unconstrained move the entire row to a temporary matrix T(E). This completes the first tableau T(0). T(0) and T(E) for the example reaction system are shown on the previous slide. Each element of this matrices will be designated Tij. Starting with x = 1 and T(0) = T(x-1) the next tableau is generated in the following way: Schilling, Letscher, Palsson, J. theor. Biol. 203, 229 (2000) Cell Simulations
idea of algorithm (1) Identify all metabolites that do not have an unconstrained exchange flux associated with them. The total number of such metabolites is denoted by . For the example, this is only the case for metabolite C ( = 1). What is the main idea? - We want to find balanced extreme pathways that don‘t change the concentrations of metabolites when flux flows through (input fluxes are channelled to products not to accumulation of intermediates). - The stochiometrix matrix describes the coupling of each reaction to the concentration of metabolites X. - Now we need to balance combinations of reactions that leave concentrations unchanged. Pathways applied to metabolites should not change their concentrations the matrix entries need to be brought to 0. Schilling, Letscher, Palsson, J. theor. Biol. 203, 229 (2000) Cell Simulations
keep pathways that do not change concentrations of internal metabolites (2) Begin forming the new matrix T(x) by copying all rows from T(x – 1) which contain a zero in the column of ST that corresponds to the first metabolite identified in step 1, denoted by index c. (Here 3rd column of ST.) Schilling, Letscher, Palsson, J. theor. Biol. 203, 229 (2000) T(0) = T(1) = + Cell Simulations
balance combinations of other pathways (3) Of the remaining rows in T(x-1) add together all possible combinations of rows which contain values of the opposite sign in column c, such that the addition produces a zero in this column. Schilling, et al. JTB 203, 229 T(0) = T(1) = Cell Simulations
remove “non-orthogonal” pathways (4) For all of the rows added to T(x) in steps 2 and 3 check to make sure that no row exists that is a non-negative combination of any other sets of rows in T(x) . Schilling et al. JTB 203, 229 Cell Simulations
repeat steps for all internal metabolites (5) With the formation of T(x) complete steps 2 – 4 for all of the metabolites that do not have an unconstrained exchange flux operating on the metabolite, incrementing x by one up to . The final tableau will be T(). Note that the number of rows in T () will be equal to k, the number of extreme pathways. Schilling et al. JTB 203, 229 Cell Simulations
balance external fluxes (6) Next we append T(E) to the bottom of T(). (In the example here = 1.) This results in the following tableau: Schilling et al. JTB 203, 229 T(1/E) = Cell Simulations
balance external fluxes (7) Starting in the n+1 column (or the first non-zero column on the right side), if Ti,(n+1) 0 then add the corresponding non-zero row from T(E) to row i so as to produce 0 in the n+1-th column. This is done by simply multiplying the corresponding row in T(E) by Ti,(n+1) and adding this row to row i . Repeat this procedure for each of the rows in the upper portion of the tableau so as to create zeros in the entire upper portion of the (n+1) column. When finished, remove the row in T(E) corresponding to the exchange flux for the metabolite just balanced. Schilling et al. JTB 203, 229 Cell Simulations
balance external fluxes (8) Follow the same procedure as in step (7) for each of the columns on the right side of the tableau containing non-zero entries. (In this example we need to perform step (7) for every column except the middle column of the right side which correponds to metabolite C.) The final tableau T(final) will contain the transpose of the matrix P containing the extreme pathways in place of the original identity matrix. Schilling et al. JTB 203, 229 Cell Simulations
pathway matrix T(final) = PT = Schilling et al. JTB 203, 229 v1 v2 v3 v4 v5 v6 b1 b2 b3 b4 p1 p7 p3 p2 p4 p6 p5 Cell Simulations
Extreme Pathways for model system 2 pathways p6 and p7 are not shown (right below) because all exchange fluxes with the exterior are 0. Such pathways have no net overall effect on the functional capabilities of the network. They belong to the cycling of reactions v4/v5 and v2/v3. Schilling et al. JTB 203, 229 v1 v2 v3 v4 v5 v6 b1 b2 b3 b4 p1 p7 p3 p2 p4 p6 p5 Cell Simulations
How reactions appear in pathway matrix In the matrix P of extreme pathways, each column is an EP and each row corresponds to a reaction in the network. The numerical value of the i,j-th element corresponds to the relative flux level through the i-th reaction in the j-th EP. Papin, Price, Palsson, Genome Res. 12, 1889 (2002) Cell Simulations
Properties of pathway matrix A symmetric Pathway Length Matrix PLM can be calculated: where the values along the diagonal correspond to the length of the EPs. The off-diagonal terms of PLM are the number of reactions that a pair of extreme pathways have in common. Papin, Price, Palsson, Genome Res. 12, 1889 (2002) Cell Simulations
Properties of pathway matrix One can also compute a reaction participation matrix PPM from P: where the diagonal correspond to the number of pathways in which the given reaction participates. Papin, Price, Palsson, Genome Res. 12, 1889 (2002) Cell Simulations
Exp. distribution of metabolic fluxes in 137 B. subtilis mutants Relative (a−e) and absolute (f−h, light gray arrows) carbon fluxes during exponential growth on glucose. Relative fluxes in a−c were analytically quantified from the mass isotope distribution by metabolic flux ratio analysis. They specify the contribution of a given pathway or reaction to the synthesis of a particular metabolite. Wild-type values are indicated by asterisks. CoA, coenzyme A; PP, pentose phosphate. Observation: Absolute fluxes in and out of the cell varied by 31 – 55% around the wt. Relative fluxes inside the cell varied only by 3-8%! Fischer & Sauer, Nature Genetics 37, 636 (2005) Cell Simulations
C13 flux analysis Fischer & Sauer, Eur J Biochem 270, 880 (2003) Cell Simulations
C13 flux analysis Fischer & Sauer, Eur J Biochem 270, 880 (2003) Cell Simulations
Calculation of metabolic flux ratios Fischer & Sauer, Eur J Biochem 270, 880 (2003) Cell Simulations
Calculation of metabolic flux ratios Fischer & Sauer, Eur J Biochem 270, 880 (2003) Cell Simulations
Effects of knockouts on absolute fluxes and optimality Fischer & Sauer, Nature Genetics 37, 636 (2005) Cell Simulations
Effects of knockouts on relative fluxes (a) Relative fluxes through glycolysis and the TCA cycle to the synthesis of glyceraldehyde-3-phosphate and oxaloacetate, respectively, as obtained from flux ratio analysis. The complementing fractions are contributed by the pentose phosphate pathway and the anaplerotic reaction. Extreme flux re-partitioning: critical reaction knockouts in TCA cycle (OdHA, SdhC, MdH), glycolysis (Pgi), or PPP (Zwf, GndA) Only 10 mutants without metabolic functions had altered intracellular fluxes. (b) Relative carbon fluxes to acetate and biomass formation. Black circle: wild type. Metabolic genes: the categories of central carbon metabolism, biosynthetic reactions and catabolic reactions. Regulatory genes: the categories of transcriptional regulators and signal transduction. The 10 mutants mentioned also have different ratios between catabolism and anabolism. Fischer & Sauer, Nature Genetics 37, 636 (2005) Cell Simulations
Effects of knockouts on relative fluxes (a) Relative fluxes through glycolysis and the TCA cycle to the synthesis of glyceraldehyde-3-phosphate and oxaloacetate, respectively, as obtained from flux ratio analysis. The complementing fractions are contributed by the pentose phosphate pathway and the anaplerotic reaction. Extreme repartioning in the peripheral biosynthetic network, pathway disruptions are mostly lethal; there are only a few bypass reactions. More redundancy exists within central carbon metabolism respond to food changes. Fischer & Sauer, Nature Genetics 37, 636 (2005) Cell Simulations
Effects of knockouts on absolute fluxes and optimality Absolute molecular fluxes at the three key divergent branch points of glucose catabolism: (a) Glucose-6-phosphate (Glc6P), (b) acetyl-coenzyme A (acetyl-coA) and (c) the branching between anabolism and catabolism. A linear correlation between partitioned fluxes shows a rigid branch point with a rate-independent flux splitting. The wild type is highlighted by a black circle. (d) Growth optimality in 137 investigated mutants. Lines indicate equal biomass productivity (g (g glucose h)-1). The white area indicates improved biomass productivity in the mutant compared with the wild type (thick line). Fischer & Sauer, Nature Genetics 37, 636 (2005) Cell Simulations
Conclusions for B. subtilis • Systematic large-scale flux analysis shows that the control architecture of central metabolism is designed to provide a rigid flux distribution that is largely independent of the rate and yield of biomass formation. • Key factor underlying the evolved robustness of metabolic networks to sustain proliferation in the face of environmental and genetic perturbations. Possible design principle: Maintain B. subtilis in a standby mode that allows rapid responses to variations in environmental conditions of its natural soil habitat. Fischer & Sauer, Nature Genetics 37, 636 (2005) Cell Simulations