Download
1 / 29
290 likes | 386 Vues
Explore strategies to manage urban sprawl in Brussels Metropolitan Area and Brussels-Capital Region, including the impact of the RER project and accompanying measures to shift towards public transport and reduce sprawl risks. Evaluate simulations of policies and their effects on mobility, land use, and transportation demand.

E N D
Testing selected solutionsto control urban sprawl The Brussels case city
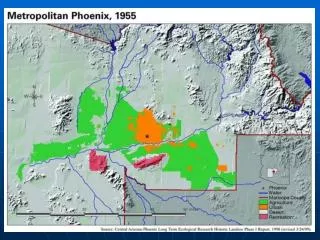
The Brussels case study • Brussels metropolitan area : • About 2.7 millions inhabitants • About 1.2 millions jobs • Brussels-Capital Region : • About 1 million inhabitants • Lost 120 000 inhabitants in 30 years • About 650 000 jobs
Brussels Metropolitan area : 2.7 millions inhabitants – 1.2 million jobs Brussels-Capital Region : 1 million inhabitants – 650 000 jobs
The RER project • High quality, rapid and frequent train services within a radius of 30 km around the centre of Brussels • Also serving the Brussels-Capital Region • Investment cost : about 900 millions € • Risk : re-launch of urban sprawl Short run impact on mobility : strong modal shift towards PT,shorter road travel times; strong reduction of fuel consumption and pollutant emissions Long run impact on spatial structure : risk of re-launch of urban sprawl; increased land consumption; longer trips; rising of the fuel consumption; road congestion springing up again within the next 20 years Necessity to implement accompanying measures
Short run impact on mobility : strong modal shift towards PT • Long run impact on spatial structure : risk of re-launch of urban sprawl
Objectives of the accompanying measures • Reinforce the modal shift from private car towards public transport • Counterbalance the long run negative effect of the RER which incites households to out-migrate towards the periphery
Transport demand : persons and goods flows from one point to another LU model TR model Where households and companies do locate, according to : • accessibilities • real estate market prices • regulations • land taxes Which mode, which path do the users use, according to : • transport networks • and their quality of service Travel times and costs between locations Integrated land use/transport modelling
Simulated accompanying measures to the RER (1/5) • Increase of car use cost : • Increase of the cost per km (+ 50 %) • Increase applied only to drivers using a company car (+100 %) • Cordon pricing (7.5 €/day) • Parking restriction : • Restriction of parking capacity alone • Capacity restriction + pricing • Test of spatially different implementations of the policy
Simulated accompanying measures to the RER (2/5) • HOV dedicated lanes on 5 radial motorways • Regional express buses on radial highways (19 lines) – dedicated lanes • In both cases : together with reduction of capacity for (single occupancy) private cars • Increase of the commercial speed of public transport • In the Brussels-capital Region • In periphery (local buses driving users to the RER stations)
Simulated accompanying measures to the RER (3/5) • Implementation of park & ride facilities • Improving intermodality at railway stations (decrease of access time) • Alternative operating scheme for the RER • Changes in the fares of public transport (-20 %, +20 %)
Simulated accompanying measures to the RER (4/5) • Improvement of quality of life in residential neighbourhoods in the inner city within the Brussels-Capital Region (5 communes) • Corollary of the previous policy : implementation of a hierarchy in the road network of the Brussels-Capital Region reduction of network capacity (by 15 %)
Simulated accompanying measures to the RER (5/5) • Territorial fiscal measures applied to households/residential developments : • Fiscal incentive (annual tax reduction) in urban areas + annual tax in suburban/rural areas • Territorial fiscal measures and regulatory measures applied to companies : • Inspired from the ABC theory • Applied to the sector “services to business”
Two stages of simulation and evaluation • First stage : Simulation of individual measures • Second stage : Combination of measures : • Combination of priority measures selected by the Administration = new reference scenario • Combination of other measures tested on the new reference
Synthesis of results – Individual measures (1/3) • Most effective policies – reduction of urban sprawl : • Road pricing • Fiscal measures related to land use • Regulatory land use measure • Indirect effects of land use policies : • Household-targeted policies : indirect effects on employment • Employment-targeted policies : indirect effects on population
Effect on the number of households in the Brussels-Capital Region
Synthesis of results – Individual measures (2/3) • All policies decreasing the generalised transport cost incite to urban sprawl : • Improvement of PT commercial speed • Reduction of PT fare • Decrease of access time to rail stations • Decrease of the generalised transport cost limited to the central area makes it more attractive : • See the results of the policy improving the PT commercial speed within the Brussels-Capital Region
Synthesis of results – Individual measures (3/3) • Most effective policies – environmental impacts : • Road pricing • Parking pricing + parking capacity restriction • Express buses • Road pricing : • Increase of cost per km / cordon pricing • Parking policy : • Local negative effect on employment • Hence : spatial competition to be carefully considered when implementing such a policy
Criteria for the design of packages • Criteria chosen in order to express the objectives : • Minimise the car mileage (proxy for the fuel consumption) • Maximise the urban concentration • i.e. the part of households and employment located in urban areas, including the Brussels-Capital Region and the peripheral urban centres
Selected policy package • Components of the selected package : • Increase of car cost per km (+ 50 %) • congestion pricing : increase of car use cost during the peak hours in the RER area • Decrease of PT fare for trips to work place (- 20 %) • Fiscal measure on residential developments • impact fee on new residential site developments • fiscal reduction in urban areas • Fiscal measure on services to business • annual impact fee per employee when located in areas poorly served by public transport

![Urban Sprawl [Date] Today I will: Know the causes, problems and solutions to Urban Sprawl.](https://cdn1.slideserve.com/1949902/slide1-dt.jpg)