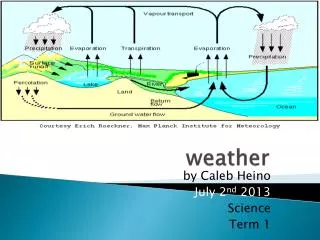
Weather
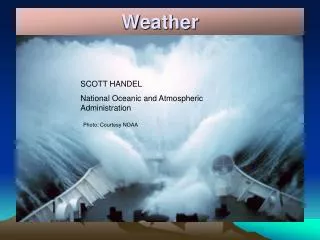
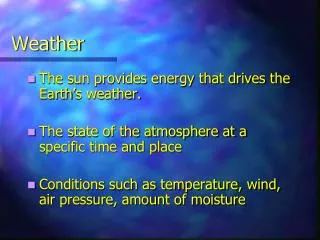
Weather. Part 7: Predicting the Weather. Meteorology. Meteorologist. A person who studies the Earth’s atmosphere to predict the weather and see the effects the weather has. The science dealing with the atmosphere and its phenomena, including weather and climate. Gathering Information.

Weather
E N D
Presentation Transcript
Weather Part 7: Predicting the Weather
Meteorology Meteorologist A person who studies the Earth’s atmosphere to predict the weather and see the effects the weather has • The science dealing with the atmosphere and its phenomena, including weather and climate
Gathering Information • Satellites – show clouds and storms at a global level • Doppler radar -measures reflected sound waves; shows the movement of precipitation over time • Local weather observations • Weather balloons • Weather stations around the world
Weather Map Symbols 1. Wind speed and direction • Points in direction wind is coming from • Tails indicate speed
Weather Map Symbols 2. Cloud Cover • Indicated by circle at end of wind symbol • The more filled in the circle is, the more cloud cover there is Author: Frasmacon
Weather Map Symbols 3. Precipitation
Weather Map Symbols 4. Position of Fronts Weather fronts cold front warm front stationary front occluded front surface trough squall line dry line tropical wave
Weather Map Symbols 5. High and Low Pressure Areas
Isotherms • Curved lines connecting areas with the same temperature • A number at the end or of or along the line indicates the temperature along the isotherm
Isotherms This is a map showing isotherms in January, circa 1910.
Isobars • Lines connecting areas with the same air pressure • Numbers at ends of, or along, the lines indicates the pressure, in millibars , inches of Hg, or mm of Hg • Numbers near: • 1000 are millibars • 30 are inches of Hg • 760 are mm of Hg