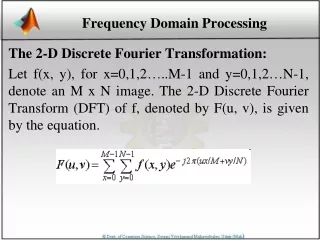
Frequency Domain Causality Analysis Method for Multivariate Systems
Frequency Domain Causality Analysis Method for Multivariate Systems in Hypothesis Testing Framework. Hao Ye Department of Automation, Tsinghua University. Outline. A Brief Introduction to Causal Analysis Two Problems of PDC

Frequency Domain Causality Analysis Method for Multivariate Systems
E N D
Presentation Transcript
Frequency Domain Causality Analysis Method for Multivariate Systems in Hypothesis Testing Framework Hao Ye Department of Automation, Tsinghua University
Outline • A Brief Introduction to Causal Analysis • Two Problems of PDC • Frequency Domain Causal Analysis Methods Based on Two Statistics • Simulation Examples • Concluding Remarks
A Brief Introduction to Causal Analysis • Causal relationship among the time series of an industrial process is of great use for fault detection, alarm management, synthesis design, and modeling, etc. • But it is often complicated and unknown in case of lack of a perfect knowledge of system structure Wiener(1956): Concept based on data Granger(1963): Granger causality Geweke(1982): Conditional Granger causality Time domain Causality Analysis methods Frequency domain Kaminski(1991): Frequency domain Granger causality Baccala(2001): Partial directed coherence (PDC) • Wide application • Some issues still need further discussions
Two Problems of PDC , Baccala and Sameshima (2001) : PDC has the ability to rank the relative interaction strength with respect to a given signal source because of the normalization. Reference: (Barrett and Seth, 2009): Granger causality can measure the strength Problem 1: PDC cannot correctly rank the causal strength
Few conclusions about what information the distribution of PDC in frequency domain can further offer. It is natural to guess that it represent how the strength of causal influence changes with ω. Two Problems of PDC monotonically decreases as ω grows Can be extended to a general first order multivariate system monotonically increases as ω grows • Only affects the dynamics of x5 • Does not affect the qualitative causal relationship Problem 2: PDC cannot describe how the causal strength changes with frequency
Frequency domain Causal Analysis Methods based on Two Statistics Baccala and Sameshima (2001) : Due to the normalization, PDC(xj→xi) may change if more (or less) signals are influenced by xj, reflects the relative rather than the absolute strength of influence • Schelter et al. (2009): Renormalized PDC (RPDC) • Schelter et al. (2009): Statistical property of RPDC • Schelter et al. (2009): Detection rule How to measure the strength of causality from xjto xi at ωwas not discussed
Frequency domain Causal Analysis Methods based on Two Statistics RPDC can be directly used to measure the strength of causality from xjto xi at ω Greater probability under null hypothesis Smaller probability under null hypothesis Stronger causal strength Weaker causal strength measure the strength of the causality between each pair of time series
Frequency domain Causal Analysis Methods based on Two Statistics (Schelter et al.,2005) : To solve the over fitting problems in model estimation Lower computation load compared with RPDC • Schelter et al. (2005): • Statistical property Measure the strength of causality from xjto xi at ω Measure the strength (and the existence) of the causality between each pair of time series
Simulation Examples , SPRDC Granger causality Sϒ The calculated strengths based on SPRDC and Sϒare consistent with those given by Granger causality
Simulation Examples monotonically decreases as ω grows monotonically increases as ω grows The distributions of RPDC or of these two processes are roughly similar as expected
Simulation Examples Frequency ω/0.01 π (0 to π ) Granger causality The distribution of Granger causality in the frequency domain is consistent with those given by PRDC and ϒ-statistics
Concluding Remarks Discussion of Problem 2: PDC cannot describe how the causal strength changes with frequency (contribution ) Discussion of Problem 1: PDC cannot correctly rank the causal strength (contribution) • Solve the two problems respectively (clear physical meaning in the hypothesis testing framework, simulation examples ) • Complex computation Baccala and Sameshima (2001) : PDC reflects the relative rather than the absolute strength of influence (Schelter et al.,2005) : To solve the over fitting problems in model estimation • Similar advantages to PRDC • Simpler computation
Concluding Remarks • Zhang J, Yang F, Ye H. Frequency domain causality analysis method for multivariate systems in hypothesis testing framework. The 19th IFAC World Progress, 2014