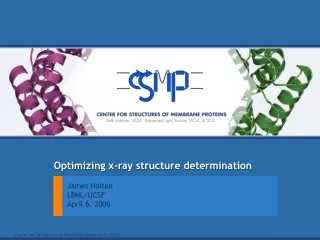
Optimizing structure determination
Optimizing structure determination. How many are we solving? What is the limit? Are we there yet? Why not? What are the biggest problems?. How many are we solving?. http://asdp.bnl.gov/asda/Libraries/pdb_statis/latest/bml/ALS.html. Breaking it down. $$ → photons


Optimizing structure determination
E N D
Presentation Transcript
Optimizing structure determination How many are we solving? What is the limit? Are we there yet? Why not? What are the biggest problems?
How many are we solving? http://asdp.bnl.gov/asda/Libraries/pdb_statis/latest/bml/ALS.html
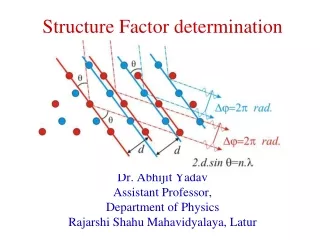
Breaking it down $$ → photons photons → data data → models models → results results → $$
Operational Efficiency “representative” 8.3.1 user
Operational Efficiency “representative” 8.3.1 user
Turning data into models 8.3.1 in 2003
Top producing beamlines of the world http://asdp.bnl.gov/asda/Libraries/pdb_statis/latest/bml/ALL.html Structures credited
What is the limit? 28 operating US beamlines ~1011 ph/μm2 exposure limit ÷ 2x10⁹ ph/μm2/s ~ 100,000 datasets/year ÷ 1324 str in 2003 ~ 2% efficient
Elven Automation Elves examine images and set-up data processing Elves run… mosflm scala solve mlphare dm arp/warp
Elven Automation Apr 6 – 24 at ALS 8.3.1
Elven Automation Apr 6 – 24 at ALS 8.3.1
Why do structures fail? Overlaps Signal to noise Radiation Damage
Ewald sphere avoidable overlaps phi mosaicity detector c* c b a
Ewald sphere unavoidable overlaps phi mosaicity detector c* c a b
Why do structures fail? Overlaps Signal to noise Radiation Damage
MAD phasing simulation mlphare results Correlation coefficient to correct model Anomalous signal to noise ratio
SAD phasing simulation mlphare results Correlation coefficient to correct model Anomalous signal to noise ratio
Incremental strategy incremental_strategy.com merged.mtz auto.mat
Why do structures fail? Overlaps Signal to noise Radiation Damage
Distention of cryo with dose before
Water ring shift saturated sucrose in 250mM WO4 0 MGy
Water ring shift saturated sucrose in 250mM WO4 184 MGy
Water ring shift saturated sucrose in 250mM WO4 Photons/s/pixel 7.5 3.8 2.5 1.9 1.5 Resolution (Ǻ)
Water ring shift GCN4-p1-N16A trigonal crystal crystal background saturated sucrose Water ring position (Ǻ) Absorbed dose (MGy)
Water ring shift http://www.lsbu.ac.uk/water/amorph.html
Water ring shift bubbles? Richard D. Leapman, Songquan Sun, Ultramicroscopy (1995)
Water ring shift Hydrogen bubbles? Richard D. Leapman, Songquan Sun, Ultramicroscopy (1995)
Water ring shift Hydrogen bubbles? “The hydrogen atom reacts with organic compounds by abstracting H from saturated molecules and by adding to centers of unsaturation, for example, http://www.rcdc.nd.edu/compilations/Rxn.pdf
Data quality vs phasing quality Correlation coefficient Exposure time (min)
Individual atoms decay at different rates Correlation coefficient to observed data Exposure time (min)
Damage changes fluorescence spectrum counts Photon energy (eV)
Damage changes fluorescence spectrum 25mM SeMet in 25% glycerol Exposing at 12680 eV Se cross-section at 12680 eV 0.0 0.2 0.4 0.6 0.8 1.0 Fraction unconverted 0 20 40 60 80 100 120 fluence (103 photons/mm2)
fluorescence probe for damage Wide range of decay rates seen Half-dose = 5.5 ± 0.6 MGy 8 mM SeMet in NaOH Half-dose = 41.7 ± 4 MGy “GCN4” in crystal 0.0 0.2 0.4 0.6 0.8 1.0 Fraction unconverted Protection factor: 660% ± 94% 0 50 100 150 200 Absorbed Dose (MGy)
Interleaved Scheduling experiment queue beamline Minor 30s Choe 120s Alberta 60s Alberta 60s Choe 30s Minor 30s
Super Tong SuperTong