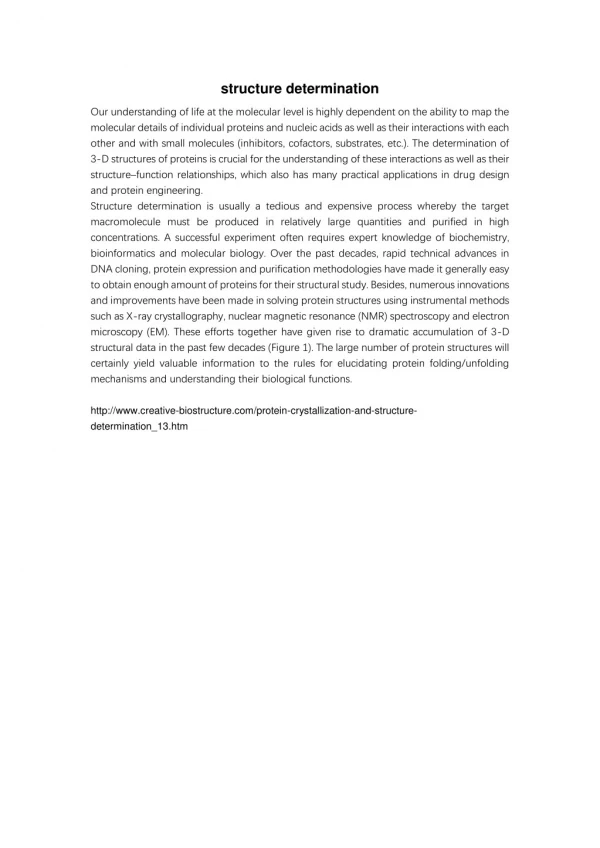
NMR Structure Determination
NMR Structure Determination. With The NMR Assignments and Molecular Modeling Tools in Hand: All we need are the experimental constraints Distance constraints between atoms is the primary structure determination factor. Dihedral angles are also an important structural constraint.

NMR Structure Determination
E N D
Presentation Transcript
NMR Structure Determination • With The NMR Assignments and Molecular Modeling Tools in Hand: • All we need are the experimental constraints • Distance constraints between atoms is the primary structure determination factor. • Dihedral angles are also an important structural constraint What Structural Information is available from an NMR spectra? How is it Obtained? How is it Interpreted?
NOE - a through space correlation (<5Å) - distance constraint NOE 4.1Å Coupling Constant (J) - through bond correlation - dihedral angle constraint J CaH NH 2.9Å Chemical Shift - very sensitive to local changes in environment - dihedral angle constraint NH CaH D Dipolar coupling constants (D) - bond vector orientation relative to magnetic field - alignment with bicelles or viruses NMR Structure Determination
Nuclear Overhauser Effect (NOE) Nuclear Overhauser Effect (NOE, h) – the change in intensity of an NMR resonance when the transition of another are perturbed, usually by saturation. Saturation – elimination of a population difference between transitions (irradiating one transition with a weak RF field) hi = (I-Io)/Io where Io is thermal equilibrium intensity irradiate N-d bb X A N N ab ba X N+d A aa Observed signals only occur from single-quantum transitions Populations and energy levels of a homonuclear AX system (large chemical shift difference)
Nuclear Overhauser Effect (NOE) Saturated (equal population) saturate N-½d bb I S N-½d N+½d ab ba I N+½d S aa Saturated (equal population) Observed signals only occur from single-quantum transitions Populations and energy levels immediately following saturation of the S transitions N-½d bb Relaxation back to equilibrium can occur through: Zero-quantum transitions (W0) Single quantum transitions (W1) Double quantum transitions (W2) W1X W1A W2 N-½d N+½d ab ba W0 W1X W1A aa N+½d
Nuclear Overhauser Effect (NOE) Intensity of NOE “builds-up” as a function of the mixing time (tm) N-½d bb W1X W1A W2 N-½d N+½d ab ba W0 W1X W1A aa N+½d Solomon Equation: Steady-state NOE enhancement at spin A is a function of all the relaxation pathways If only W1,noNOE effect at HA If W0 is dominant, decrease in intensity at HA negative NOE If W2 is dominate, increase in intensity at HA positive NOE For homonuclear (gX=gA), maximum enhancement is ~ 50% For heteronuclear (gX=gA), maximum enhancement is ~50%(gX/gA)
tc ~ 10ns (macromolecule) tc ~ 10ps (small molecule) 1/tc Nuclear Overhauser Effect (NOE) • Mechanism for Relaxation • Dipolar coupling between nuclei • interaction between nuclear magnetic dipoles • local field at one nucleus is due to the presence of the other • depends on orientation of the whole molecule • in solution, rapid motion averages the dipolar interaction • in crystals, positions arefixed for single molecule, but vary between molecules leading range of frequencies and broad lines. • Dipolar coupling, T1 and NOE are related through rotational correlation time (tc) • recall: rotational correlation is the time it takes a molecule to rotate one radian (360o/2p) Relaxation or energy transfers only occurs if some frequencies of motion match the frequency of the energy transition. The available frequencies for a molecule undergoing Brownian tumbling depends on tc. The total “power” available for relaxation is the total area under the spectral density function.
Nuclear Overhauser Effect (NOE) • Mechanism for Relaxation • Spectral density is constant for w << 1/tc • tc decreases, wo also decreases and T1 increases • at 1/tc≈wo there is a point inflection • W2 falls off first since it it the sum of two transitions • relaxation rates via dipolar coupling are: NOE is dependent on the distance (1/r6) separating the two dipole coupled nuclei Important: the effect is time-averaged! Extreme narrowing limit: 1/tc >>wo then wo2tc2 <<1)
2D NOESY (Nuclear Overhauser Effect) Relative magnitude of the cross-peak is related to the distance (1/r6) between the protons (≥ 5Ǻ). NOE is a relaxation factor that builds-up during The “mixing-time (tm)
NMR Structure Determination How DO We Go From the NOESY Data to A Structure? 2D NOESY Spectra at 900 MHz Lysozyme Ribbon Diagram
NMR Structure Determination We Need to Assign Each NOE Cross-Peak to A Specific 1H-1H Pair from Assignment Table. Assignment Table . . . What H assignments for the protein are consistent with 10.5 ppm & 7.65 ppm? 10.5 ppm to 7.65 ppm In some cases, the chemical shifts associated with the NOE cross-peak are unique and an assignment is straight-forward. More likely is the occurrence that the assignment is ambiguous multiple possible assignments to one or both of the chemical shifts.
NMR Structure Determination We Need to Assign Each NOE Cross-Peak to A Specific 1H-1H Pair from Assignment Table. Assignment Table . . . To determine the structure, an assignment has to be made for each of the thousands of observed NOE cross peaks A lot of manual effort! Ambiguity in assignments also arises from errors in peak position and correlation to assignment table. Need to “match” assignments with an error range that is dependent on the resolution associated with each axis. Typically, 1H errors may range from 0.02 to 0.06 ppm and 13C, 15N from 0.25 to 1.0 ppm. An NOE cross-peak of 4.25 ± 0.02 ppm to 2.21 ± 0.02 ppm may be consistent with a dozen or more possible combinations!
NMR Structure Determination • Peak-Picking is Very Challenging in A Protein NOESY Spectra • Spectra Can be very crowded with a number of • overlapping peaks • Automatic peak-picking fails in these crowded regions • the quality of the structure is inherently dependent on the quality of the peak-picking • assignments are made from the peak lists • wrong peak position or picked noise peaks results in a mis-assignment that results in an incorrect structure distance constraints that results in a local distortion in the structure How Many Peaks? What is each Peak’s Position? Which are Noise Peaks?
NMR Structure Determination • How Do We Resolve These Peak-Picking and Ambiguity Issues? • Spread out the data into 3D and 4D • symmetry can help remove ambiguities • Use 1H-15N and 1H-13C connections • Iterative analysis of the NOE data • use structure and distance filter to remove ambiguities
NMR Structure Determination • Iterative Analysis of NOESY Data, How Does It Work? • Assign All unique or unambiguous NOEs • Calculate Initial Structure with All the Data possible • Use the Structure to Filter Ambiguous Assignments • possible assignment has to be ≤ 6 Ǻ • removes all possible assignments with distances ≥ 6Ǻ • Calculate New Structure With New constraints • identify & correct violated constraints • repeat NOE analysis • repeat process until all NOEs correctly assigned and a quality structure is obtained
NMR Structure Determination • Using PIPP to Analyze NOESY Data • read in your initial structure(s) • read in your NMR assignment list • click on a peak and PIPP tells you: • the possible assignments • chemical shift errors relative to assignment table • minimum, average and standard deviation distances
NMR Structure Determination • After Assigning an NOE Peak to 1H-1H pair, Need to Assign a Distance Constraint • There are Two Generally Accepted Approaches: • “Two-Spin” Approximation • Relaxation Matrix Approach “Two-Spin” Approximation – the observed volume or intensity of a NOE cross-peak is directly related to the distance between the 1H-1H pair This approximation only holds true for the linear part of the NOE build-up curve (short-mixing times) when spin diffusion is not a significant component of the observed volume (intensity)
NMR Structure Determination Spin Diffusion – in the limit of wtc >> 1 (biomolecules), the rate of transfer of the spin energy between nuclei becomes much larger than the rate of transfer of energy to the lattice. The observed NOE cross-peak volume between Hi & Hj is potentially increased by a HiHkHj & HiHlHj energy transfer. Effectively, the spin energy diffuses through all possible paths between all possible spin systems. Spin diffusion is always present, the magnitude depends on the mixing time and the efficiency of any particular pathway. The longer the path, the smaller the energy that is transferred
NMR Structure Determination • As We Discussed Before, One Common Approach Uses a Qualitative Binning of NOE Intensities • generally cluster NOE volumes into strong, medium, weak and very weak • The following rules apply: • Strong 2.5 0.7 0.2 for NH-NH constraints use: 2.5 0.7 0.6 • Medium 3.0 1.2 0.3 for NOEs with NH use: 3.0 1.2 0.5 • Weak 4.0 2.2 1.0 • Very Weak 5.0 2.0 1.0 • the lower limit is always set to slightly less than twice the hydrogen van der Waals radius (1.8Å) • NOEs for methyls are scaled down by 1/3 • Uses reasonably short mixing-time (100-150msec) and allows quantity of distance constraints to correct for spin-diffusion effects • remove or move to lower bin violated constraint that may arise from spin-diffusion • alternative is to leave all constraints as observed with corresponding contribution to violation energy and potential structure distortion point of debate in NMR community NOEs are observed between the Ala methyl and both Leu methyls. Structure indicates a violation to one methyl-methyl pair NOE probably a result of spin diffusion Violated constraint
NMR Structure Determination • Two-Spin Approximation • Instead of binning into strong, medium, weak and very weak, can assign a relative distance • Use a reference volume with a known fixed distance to calibrate all volumes • 2.52 Åfor Leu Ha-Hb • 2.52 Å for Phe or Tyr Hd-He Serious Problems: obtain a highly precise distance that ignores all the inherent errors associated with the accuracy of measuring volumes, spin-diffusion and dynamics. Short, inaccurate distance constraints cause severe local structure distortions What would happen to the structure if both Leu d had to be 3Å to the Ala b? Violated constraint
NMR Structure Determination • Relaxation Matrix Approach Takes Into Account Spin-Diffusion • removes manual and potentially biased approach to identify spin-diffusion issues • From the structure, calculates a spin relaxation matrix to correct for spin-diffusion contributions to observed volumes • There are a number of programs that perform this analysis (CORMA, FIRM, MardiGras, MORASS, etc) Experimental Volumes from NOESY spectra Calculate from structure J. Am. Chem. Soc. 1990, 112, 6803-6809
NMR Structure Determination • Relaxation Matrix Approach Takes Into Account Spin-Diffusion • Merge the cross-relaxation rates calculated from the structure with experimental volumes • obtain distance matrix to calculate new structure • iterate process Can relate cross-relaxation rates(G) with experimental NOE volumes (V)
NMR Structure Determination • Problems with Relaxation Matrix Approach • Errors and Failures with Matrix Calculations • Do not obtain complete experimental NOESY volume matrix • Very difficult to accurately measure diagonal peaks • Significant errors in measuring experimental volumes • Peak overlaps and degenerate assignments • Missing peaks, limits of S/N • Noise • Assume Uniform Dynamics (tc) • Poor Assumption • Different regions of protein structure have very different local dynamics • Contributions to relaxation rates by dynamics can be much more significant than spin-diffusion • Output of calculation is a very specific distance constraint • But, may have high errors (volume, dynamics) • Large structure distortion that is propagated through iteration
NMR Structure Determination • Two Very Important Facts to Remember • NOEs Reflect the Average Distance • Protein Structures Are Dynamic In reality, protein undergoes wide-ranges of motions (snapshots of 100 BPTI conformations) We visualize protein structures as a static image J. Mol. Biol. (1999) 285, 727±740
2D, 13C, 15N Labeled Protein NMR Data Collection Secondary Structure Resonance Assignments X-ray or Homology Model C.S NOE Low Resolution Structure Dock Ligands High Resolution Structure NMR Structure Determination We have already discussed labeling the protein, data collection and the resonance assignment Next Step, is to identify which residues adopt which secondary structure present
NMR Structure Determination • Protein Secondary Structure and NOE Patterns • a-Helix • Sequential NOEs observed in 3D 15N-edited NOESY are indicative of a-helix
NMR Structure Determination • Protein Secondary Structure and NOE Patterns • a-Helix • Sequential NOEs observed in 3D 15N-edited NOESY are indicative of a-helix
NMR Structure Determination • Protein Secondary Structure and NOE Patterns • a-Helix • Sequential NOEs observed in 3D 15N-edited NOESY are indicative of a-helix
NMR Structure Determination • Protein Secondary Structure and NOE Patterns • a-Helix • Sequential NOEs observed in 3D 15N-edited NOESY are indicative of a-helix
NMR Structure Determination • Protein Secondary Structure and NOE Patterns • a-Helix • Sequential NOEs observed in 3D 15N-edited NOESY are indicative of a-helix
NMR Structure Determination • Protein Secondary Structure and NOE Patterns • b-Sheet • Across strand NOEs observed in 3D 15N-edited NOESY and 3D 13C-edited NOESY are indicative of b-sheet
NMR Structure Determination • Protein Secondary Structure and NOE Patterns • b-Sheet • Across strand NOEs observed in 3D 15N-edited NOESY and 3D 13C-edited NOESY are indicative of b-sheet
NMR Structure Determination • Protein Secondary Structure and NOE Patterns • b-Sheet • Across strand NOEs observed in 3D 15N-edited NOESY and 3D 13C-edited NOESY are indicative of b-sheet
NMR Structure Determination • Protein Secondary Structure and NOE Patterns • Turns • Sequential NOEs observed in 3D 15N-edited NOESY are indicative of turns • Similar to a-helix, shorter amino acid stretches connect b-strands
NMR Structure Determination • Protein Secondary Structure and NOE Patterns • Turns • Sequential NOEs observed in 3D 15N-edited NOESY are indicative of turns • Similar to a-helix, shorter amino acid stretches connect b-strands
NMR Structure Determination Protein Secondary Structure and Carbon Chemical Shifts Chemical shift differences between Ca,Cb random-coil values and experimentally observed values yields secondary structure chemical shift. Helix: DCa ~ 3 ppm DCb ~ -1 ppm b-strand: DCa ~ -2 ppm DCb ~ 3 ppm
a1 bIV bIII a2 a3 bI bII a4 NMR Structure Determination Protein Secondary Structure and Carbon Chemical Shifts
NMR Structure Determination • Protein Secondary Structure and Carbon Chemical Shifts • TALOS + Shen et al. (2009) J. Biomol NMR44:213
NMR Structure Determination • Protein Secondary Structure and Carbon Chemical Shifts • TALOS+ • Given the Ca, Cb Chemical shift assignments and primary sequence • Compares the secondary chemical shifts against database of chemical shifts and associated high-resolution structure • comparison based on “triplet” of amino acid sequences present in database structures with similar chemical shifts and secondary structure • Provides potential f , y backbone torsion constraints • Issues: May not provide a unique solution, two or more sets of f , y are possible. Can not initially use TALOS results if ambiguous. Can add constraint latter if consistent with structure.
NMR Structure Determination • Protein Secondary Structure and Carbon Chemical Shifts • TALOS+ TALOS may provide relatively tight error bounds associated with the predicted f,y. It is better being more conservative by using minimal errors of: f ± 30 y ±50 c ± 20
NMR Structure Determination • Protein Secondary Structure and 3JHNa • Karplus relationship between f and 3JHNa • f =180o 3JHNa = ~8-10 Hz b-strand • f = -60o 3JHNa = ~3-4 Hz a-helix Vuister & Bax (1993) J. Am.Chem. Soc.115:7772
NMR Structure Determination • Protein Secondary Structure and 3JHNa • Karplus relationship between f and 3JHNa • Measure 3JHNa for a protein using HNHA • Ratio of cross-peak to diagonal intensity yields coupling constant • Common approach to measure coupling constants in complex protein NMR spectra J. Am. Chem. Soc. 1993,115, 7772-7777
NMR Structure Determination • Protein Secondary Structure and NH Exchange Rates • Relatively Slower Exchanging NHs are involved in Hydrogen Bonds or Buried • Hydrogen Bonds are an important component of secondary structures NH Exchange Rate
NMR Structure Determination • Protein Secondary Structure and NH Exchange Rates • Measure Relatively Slow Exchanging NHs • Exchange NMR sample into 100% D2O and measure series of 1H-15N HSQC as a function of time. • Observed slowly exchanging NHs are • correlated with secondary structure. • Secondary structures identified from NOEs, chemical shifts and 3JHNa • Assign hydrogen-bond distance constraint J. Mol. Biol. (1997) 271, 472-487
NMR Structure Determination • Protein Secondary Structure and NH Exchange Rates • Measure Fast Exchanging NHs • CLEANEX-PM experiment • amount of exchange depends on mixing time • Missing Peaks are slowly exchanging NHs • Observed slowly exchanging NHs are • correlated with secondary structure. • Secondary structures identified from NOEs, • chemical shifts and 3JHNa • Assign hydrogen-bond distance constraint selects H2O NH exchange with H2O during spin-lock 2D 1H-15N HSQC CLEANEX-PM J. Am. Chem. Soc. (1997) 119, 6203 J. Biomol. NMR (1998) 11:221
NMR Structure Determination • Protein Secondary Structure and NH Exchange Rates • Measure Fast Exchanging NHs • CLEANEX-PM experiment • amount of exchange depends on mixing time • Can measure exchange rates by varying mixing time • Missing Peaks are slowly exchanging NHs
NMR Structure Determination • Protein Secondary Structure and NH Exchange Rates • Assign Hydrogen-Bond Distance Constraints for Slowly Exchanging NHs For a –helix hydrogen bond constraints: constraint between Oi & Ni+4 2.8 0.4 0.5 constraint between Oi & HNi+4 1.8 0.3 0.5 For b –sheet hydrogen bond constraints are Across strands: constraint between Oi & Nj 2.8 0.4 0.5 constraint between Oi & HNj 1.8 0.3 0.5
NMR Structure Determination • Protein Secondary Structure Summary • Secondary Structure NOEs, slowly exchanging NHs, 3JNHa and secondary structure chemical shifts provide the foundation for detemining a protein NMR structure
NMR Structure Determination • Protein Tertiary Structure Determination • Include all the various structural information, disulphide bonds, hydrogen bonds, dihedral angles, chemical shifts, coupling constants, and NOES (distance constraints) to calculate (FOLD) the structure using simulated annealing Anal. Chem. 1990, 62, 2-15 Depiction of short-range and long range NOEs
Simply Need to Complete the Assignment of All the Remaining NOEs in an Iterative Process to Obtain the Structure
NMR Structure Determination • Automated Protein Structure Determination • A number of efforts are on-going to automate the process (ARIA, • AutoStructure, CYANA, Rosetta, etc) • From assignment tables, NOE peak lists, coupling constants and slowly exchanging NHs.