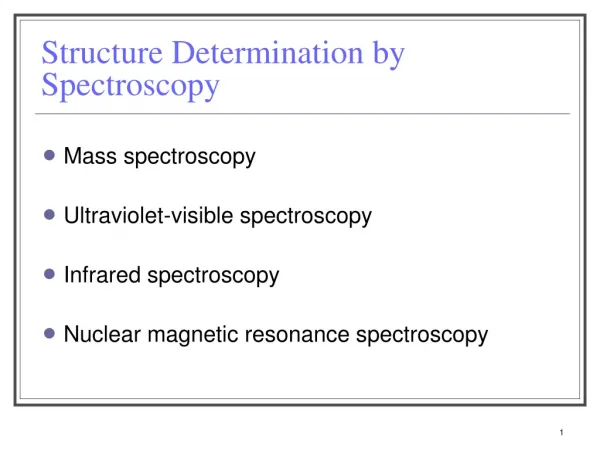
Understanding NMR Spectroscopy: Techniques and Applications in Biological Chemistry
This resource provides comprehensive insights into the structure determination of biomolecules using Nuclear Magnetic Resonance (NMR) spectroscopy. Led by Karl D. Bishop, Ph.D., it discusses one-dimensional (1D) and two-dimensional (2D) NMR techniques, including resonance assignment procedures and experimental setups like COSY and NOESY. Additionally, it includes links to free NMR demo programs and software resources, as well as NMR analysis examples, particularly focusing on proteins like Ubiquitin. Ideal for students and researchers in biological chemistry.

Understanding NMR Spectroscopy: Techniques and Applications in Biological Chemistry
E N D
Presentation Transcript
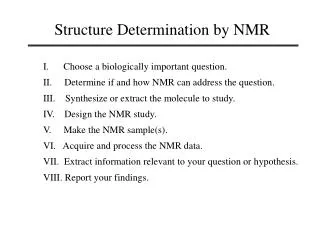
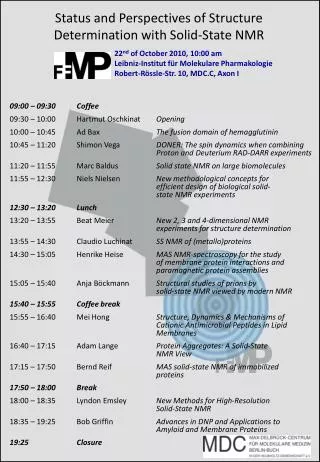
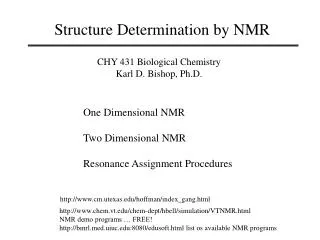
Structure Determination by NMR CHY 431 Biological Chemistry Karl D. Bishop, Ph.D. One Dimensional NMR Two Dimensional NMR Resonance Assignment Procedures http://www.cm.utexas.edu/hoffman/index_gang.html http://www.chem.vt.edu/chem-dept/hbell/simulation/VTNMR.html NMR demo programs … FREE! http://bmrl.med.uiuc.edu:8080/edusoft.html list os available NMR programs
w x Acquiring the FID z y time voltage Receiver/transmitter The receiver coil picks up the signal from the sample. An analog-to-digital converter “reads” the voltage and sends it to the computer for data storage.
w x One Dimensional NMR z Mo y x x x 90x FID FT time frequency in ppm
Two Dimensional NMR The two principle types of 2D NMR experiments are NOESY and COSY. These can be either homonuclear, 1H-to-1H, or heteronuclear, 13C-to-1H. A 2D data set can be thought of as a stack of 1D files. Each 1D file is different from the next by a change in t1. All other parameters are kept constant except the phase of the pulses. Fourier transformation of each 1D in the t2 domain creates an interferogram. The t1 domain is then Fourier transformed resulting in a 2D file with the frequency in each dimension. This 2D file will provide a map of all spin-to-spin correlations
COSY 2D Experiment y w w x x x 90x 90y t1 t2 preparation evolution acquisition The two dimensions are t1 and t2.
FT FT FT FT FT · FT · · · · · COSY 2D Experiment t1 = 750ms t1 = 600ms t1 = 450ms t1 = 300ms t1 t1 = 150ms t1 = 0ms t2 f2 Typically there will be ~128-to-512 t1 increments in a single 2D data file. t1
Interferogram FID t1 f2 f1 f1 f2 f2 The Interferogram t1 Contour plot. 2D plot of data Bax and Morris, Jl. Magn. Res., 42, 501-05 (1981).
NOESY 2D Experiment 90n 90n 90y Tm t2 t1 preparation evolution mixing acquisition • The two dimensions are t1 and t2. • t2 is the amount of time to acquire each FID. • t1 is an incremented time period or evolution time. • Tm is the “mixing time” during which the dipolar through-space coupling is allowed.
Polypeptide Spin System 7-10 ppm 3.5-6.0 ppm Denotes spin systems in the individual residues Denotes the aH-NH COSY connectivities Denotes the sequential NOE connectivities “NMR of Proteins and Nucleic Acids” Wuthrich, p131, (1986).
Sequential and Medium Range Distances “NMR of Proteins and Nucleic Acids” Wuthrich, p118, (1986).
Side Chain Coupling Patterns diagonal peaks COSY peaks relayed COSY +, * “NMR of Proteins and Nucleic Acids” Wuthrich, p136, (1986).
Side Chain Coupling Patterns “NMR of Proteins and Nucleic Acids” Wuthrich, p136, (1986).
Backbone Coupling in Peptides “NMR of Proteins and Nucleic Acids” Wuthrich, p119, (1986).
NMR Analysis of Ubiquitin 158 residues 1286 atoms 1305 bonds Brookhaven 1A3S 4 alpha helical regions 1 or 2 b sheet residues.
Sample NMR Spectra of Ubiquitin obtained from Georgetown's 500 MHz Unity INOVA NMR Spectrometer Samples courtesy of Ms. Tao Wang (Prof. David Yang's research group)
2D COSY of Ubiquitin Cavanaugh et al., 1996
NMR Analysis of Ubiquitin Cavanaugh et al., 1996
Sample NMR Spectra of Ubiquitin obtained from Georgetown's 500 MHz Unity INOVA NMR Spectrometer Samples courtesy of Ms. Tao Wang (Prof. David Yang's research group)
Sample NMR Spectra of Ubiquitin obtained from Georgetown's 500 MHz Unity INOVA NMR Spectrometer Samples courtesy of Ms. Tao Wang (Prof. David Yang's research group)