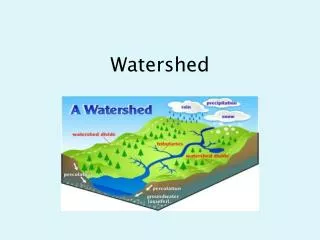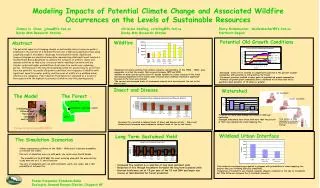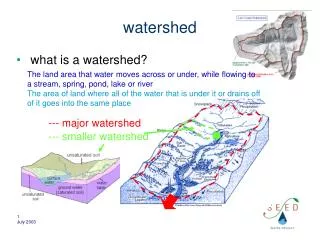
Virtual Watershed
Virtual Watershed. NSF Biocomplexity in the Environment Program 2004-2008 Christopher Lant ( Geograph y) PI Steven Kraft, Jeff Beaulieu ( Agr. Economics ) John Nicklow ( Civil Engineering ) Michelle Zhu ( Computer Science ) Raja Sengupta ( Geography ) McGill

Virtual Watershed
E N D
Presentation Transcript
Virtual Watershed NSF Biocomplexity in the Environment Program 2004-2008 Christopher Lant (Geography) PI Steven Kraft, Jeff Beaulieu (Agr. Economics) John Nicklow (Civil Engineering) Michelle Zhu (Computer Science) Raja Sengupta (Geography) McGill George Malanson (Geography) Iowa
Corn Other crops Pasture Wheat Soybean Forest Urban Water Land Use is the Lynchpin Between Social Factors and Environmental Results
Contingent probabilities of land use in a field given land uses in the previous year Probability that a hectare will contain Use last Year Corn Soy Double Grass Forest Total All Corn .07 .81 .01 .11 .00 1.00 All Soybeans .48 .34 .01 .17 .00 1.00 Double Crop.03 .24 .02 .72 .00 1.00 Pasture/Hay.02 .07 .01 .89 .00 1.00 Forest .00 .00 .00 .00 1.00 1.00
Land Use Change Hypotheses • The use chosen for a field is influenced by the physical geographic characteristics of the field such as soil type and slope. (Yes) • (2) The use chosen for a field is influenced by economic costs and opportunities for various uses. (Yes) • (3) The use chosen for a field is influenced by the historical use of that field. (Yes) • (4) The use chosen for a field is influenced by the use of neighboring fields. (No)
Ecosystem Services: The benefits people obtain either directly or indirectly from ecosystems (Millennium ecosystem assessment)
Carbon storage Maintenance of biodiversity Cycling of nutrients
Ecological-Economic Production Possibility Frontiers and their Evolution
Create sets of Initial Alternatives (Initial Population) Evaluate fitness, Rank the alternatives GA Logic Choose mates(pairing) Repeat Create offspring (crossover) Multiple Generations lead to Optimal Solution Mutate Optimal Solution
Sediment and Water Quality Index: Highly Correlated R = -0.97
Phosphorus and Water Quality Index: Highly Correlated R = -0.99
Nitrogen and Water Quality Index: Highly Correlated R = -0.98
Corn and Water Quality: A Trade-Off R = -0.83
Hay and Water Quality: Complementary R = 0.90
Hay and Flood Control: Complementary R = 0.71
The Overall Ecological-Economic PPF R = -0.83
What We’ve Learned About the PPF • Landscapes that yield high or low sediment yields also yield corresponding N and P yields with correlations of 0.93 - 0.98. • Competition among crops for land produces as classic PPF • Soybeans, and especially corn, is a trade-off with all ecosystem services, but hay is complementary. • Carbon correlates positively with water quality at 0.84. • 5) The current land use pattern is very sub-optimal, more so with respect to ecosystem services than gross margin.
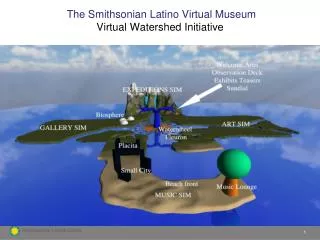
Any Questions? Virtual Watershed Diagram from Proposal
Key Papers Nicklow, J.W., S.E. Kraft, C.L. Lant, and E.G. Bekele, 2005. Virtual Watershed: Steps Toward Cost-Effective Generation of Ecosystem Services in Rural Watersheds. Proceedings of the IWRA World Water Congress. Nicklow, J.W., G. Misgna, C.L. Lant, and S.E. Kraft, in press, Evolution of Agricultural Watersheds in a Systems Management Framework. ASCE Monograph on Systems Education Lant, C.L. Ecological Economics and Water Resources Geography. Journal of Contemporary Water Research and Education 142: 52-56. Lant, C.L., J.B. Ruhl, and S.E. Kraft, 2008. The tragedy of ecosystem services. Bioscience 58(10): 969-974. Lant, C.L. Kraft, S.E., J. Beaulieu, D. Bennett, T. Loftus, and J. Nicklow, 2005. Using GIS-Based Ecological-Economic Modeling to Evaluate Policies Affecting Agricultural Watersheds. Ecological Economics 55(4): 467-484.