Download
1 / 1
10 likes | 111 Vues
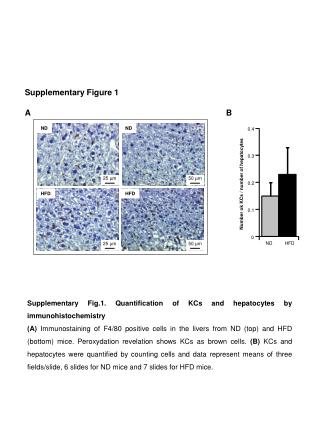
Explore the immunohistochemical quantification of Kupffer cells and hepatocytes in livers from normal diet (ND) and high-fat diet (HFD) mice. Peroxidation revelation highlights Kupffer cells as brown cells, with quantification by cell counting. Data represent means from multiple slides for each group.

E N D
Supplementary Fig.1. Quantification of KCs and hepatocytes by immunohistochemistry (A) Immunostaining of F4/80 positive cells in the livers from ND (top) and HFD (bottom) mice. Peroxydation revelation shows KCs as brown cells. (B) KCs and hepatocytes were quantified by counting cells and data represent means of three fields/slide, 6 slides for ND mice and 7 slides for HFD mice. ND HFD Supplementary Figure 1 A B ND ND 25 µm 50 µm HFD HFD 25 µm 50 µm 0.4 0.3 0.2 Number ok KCs / number of hepatocytes 0.1 0


